Fall, 2020
Read the welcome slides.
Install the Anaconda Python (v3) distribution on your computer.
Choose a code editor and install it if required. It may be easiest for you to use Spyder, which comes installed as part of the Anaconda Python distribution. It is an IDE (integrated development environment) not unlike RStudio or MATLAB.
There is another IDE called PyCharm which is similar to Spyder that you could have a look at as well.
Some other possibilities are: Sublime Text, which is available for MacOS, Windows, and GNU/Linux, and costs a bit of money, and Visual Studio Code and Atom, both of which are free. All three have Python extensions: Anaconda for Sublime Text, Python Visual Studio Code, and Atom IDE-python package. Of course you can also use Emacs or Vim if you are in a retro mood. It doesn’t much matter what editor you use, it’s totally up to you.
Read “Think Python”, Chapter 1.
Read “Python for Data Analysis”, Chapters 1, 2.1, and 2.2.
Launch ipython3 and type the following to make sure that things are working. Type the code in, don’t copy and paste it. The more you type things in by hand, the more you will start to understand how it works. Copying and pasting though faster does not facilitate understanding.
import matplotlib.pyplot as plt
import pandas as pd
url = "https://www.gribblelab.org/scicomp2020/AAPL.csv"
aapl = pd.read_csv(url)
aapl["Date"] = pd.to_datetime(aapl["Date"])
aapl.set_index("Date", inplace=True)
fig = plt.figure(figsize=(8,4))
plt.plot(aapl["Adj Close"])
plt.title("AAPL Adjusted Closing Price: Past 365 Days")
plt.xlabel("Year")
plt.ylabel("Price ($)")
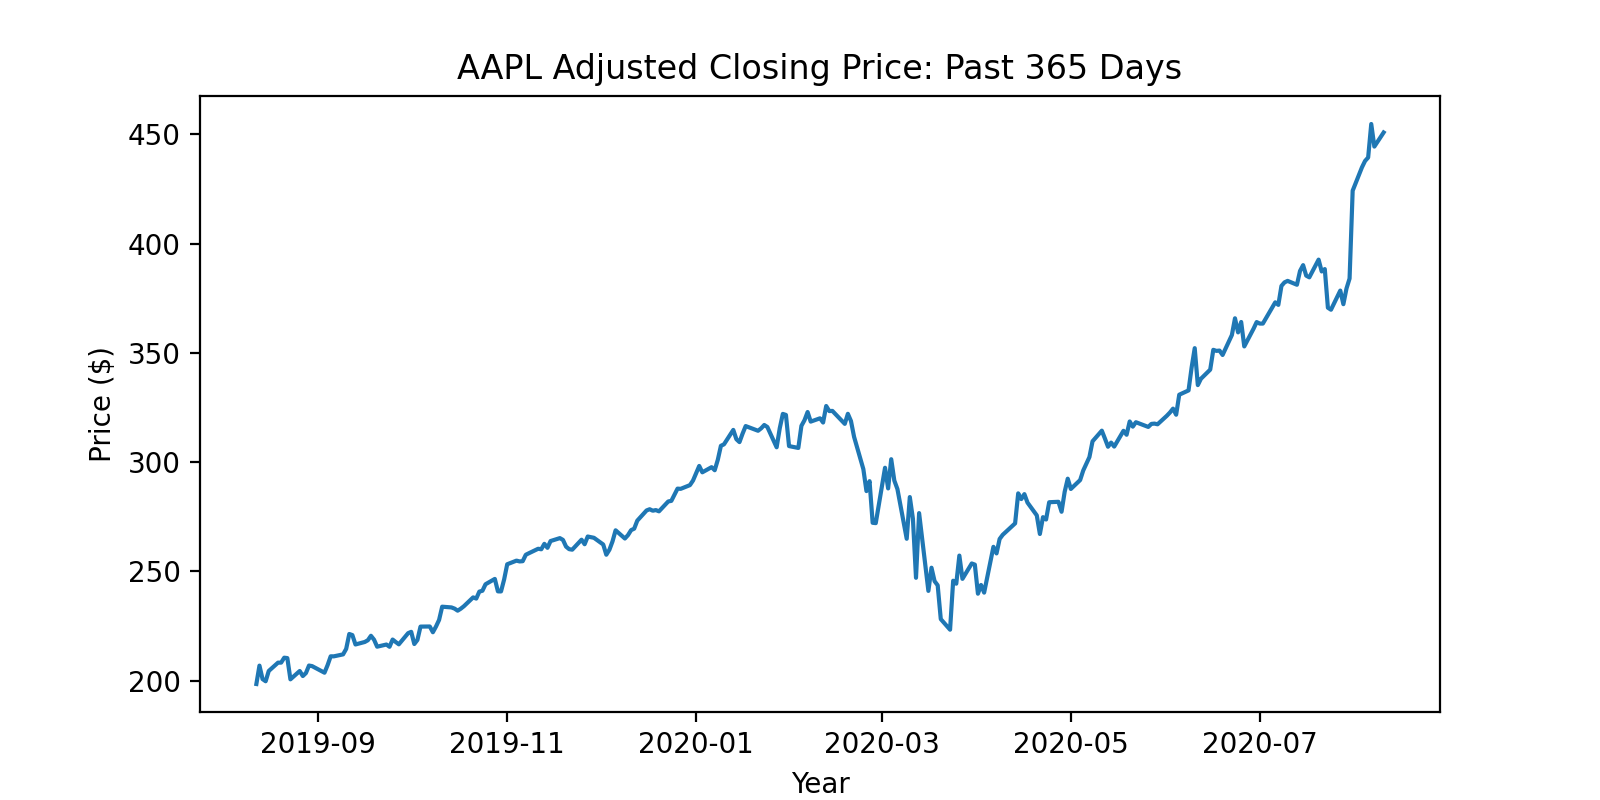
plt.show()You should see a figure like this:
There is no graded assignment this week but there is a task for you to complete:
Try out the Jupyter Notebook way of running Python. The text describes it in Chapter 1, on pages 18-21. You may decide on this method of using Python for data analysis, instead of using a command prompt and a text editor. It really comes down to personal preference.
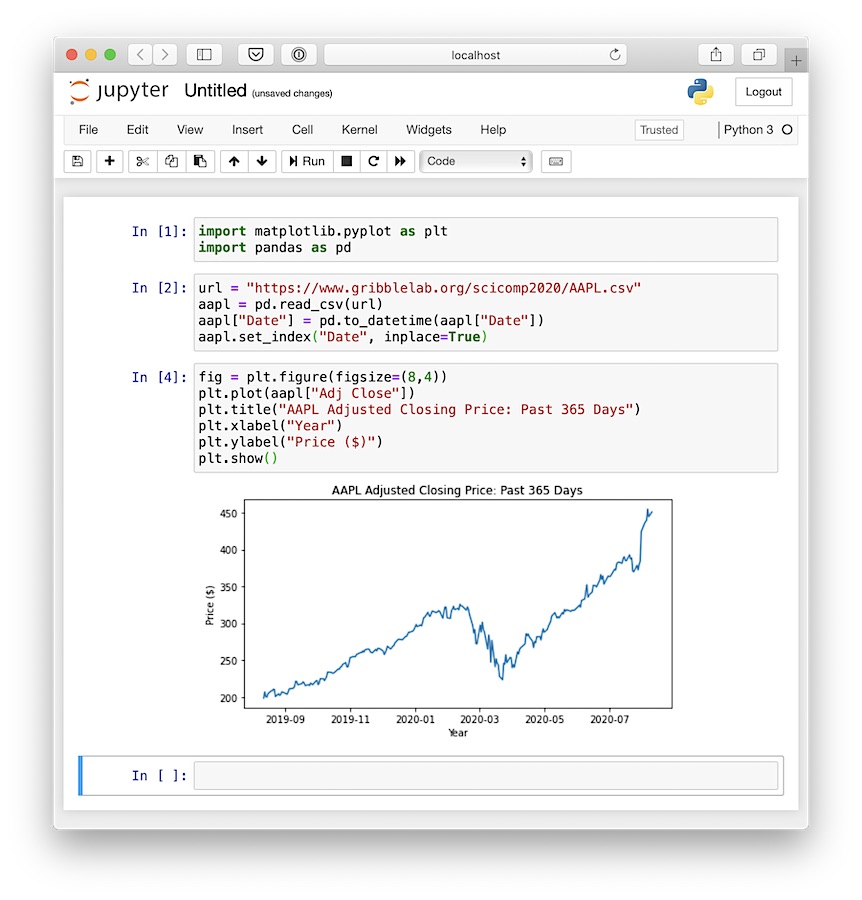
Launch jupyter-notebook, create a new Python 3 notebook, and enter the code above in to three code blocks. After executing each code block you should see something like this: