To grab certain rows of a data tibble, we can use the following dplyr command:
filter()
select()
slice()
arrange()
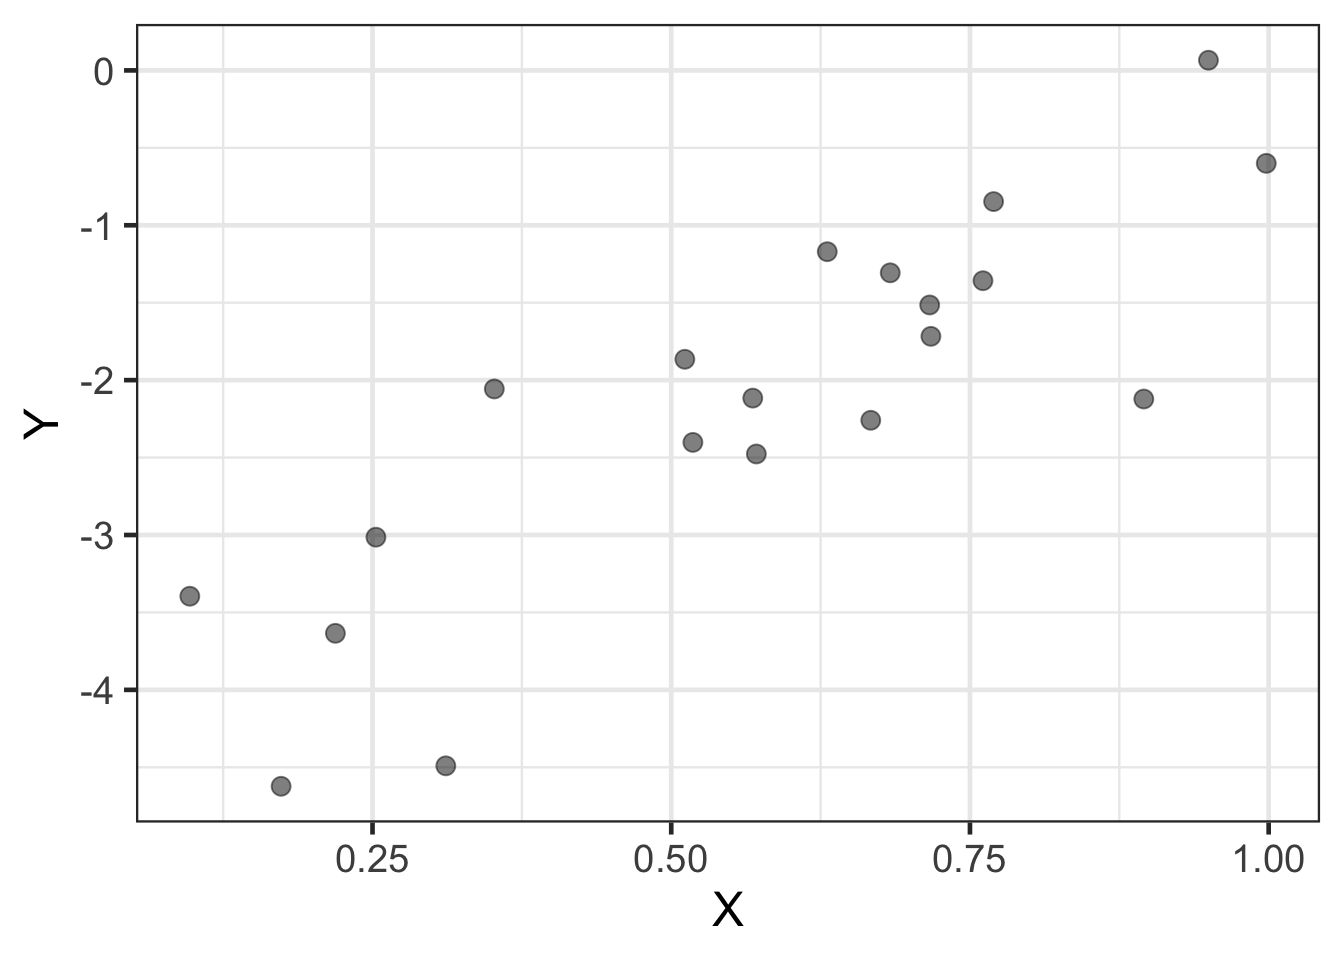
In the figure shown below, there is a ______ correlation between X and Y:
positive
negative
zero
none of the above
Warning: package 'lubridate' was built under R version 4.3.1
Short Answer (2 pts each)
Jessie estimates a linear regression model to predict monthly spending on groceries (\(y\)) from monthly income (\(x\)). They find that the estimated regression equation is \(y = 0.5 + 0.2x\) and that the p-value for the slope is \(p=0.02\). What does the slope coefficient \(0.2\) mean? What does the p-value \(0.02\) mean?
Long Answer (5 pts each)
Ripley esimates a multiple linear regression model to predict credit card spending (\(Y\)) from monthly income (\(X_{1}\)), age (\(X_{2}\)), and number of children (\(X_{3}\)). They find that the estimated regression equation is \(Y = 100 + 0.2X_{1} + 0.1X_{2} - 0.5X_{3}\). Describe the steps you would take to refine the model and explain the rationale for each step.