Repeated Measures ANOVA

Week 11

Final Exam

  • I will post some sample questions on the course website in the next week or so
  • review the lecture slides
  • review the readings
  • review the homeworks
  • focus on concepts first not the tiniest details

Repeated Measures Experiments

  • sometimes also called “within-subjects” or “within-participants”
  • the same participant is measured on the same dependent variable multiple times (more than 2)
  • (if only 2 measurements just use a paired samples t-test)

Repeated Measures Experiments

  • e.g. the same participant is measured on their mood (1) before and (2) after a treatment and then (3) again after a week
  • effects of placebo vs treatment A vs treatment B on blood pressure can be studied in the same participants, each participant can serve as their own control
  • behaviour of subjects can be studied over multiple time points

Advantages of Repeated Measures Designs

  • sometimes participants can serve as their own control
    • (no need for a separate control group)
  • variance between levels of a factor is reduced
    • no longer due to effect + inter-subject variability
    • it’s the same subjects!
  • variance across levels of the factor is only due to the effect of the factor

Advantages of Repeated Measures Designs

  • more information is obtained from each participant than in a between-subjects design
  • within-subjects design: each subject contributes a scores
    • (a = number of levels of the repeated-measures factor)
  • between-subjects design: each subject contributes only 1 score
  • the number of subjects required to reach a given level of statistical power is often much lower in a within-subjects design than in a between-subjects design

Advantages of Repeated Measures Designs

  • same subject measured in each level of the factor
  • variability in individual differences between subjects is removed from the ANOVA error term
  • ANOVA error term (denominator of the F ratio) is reduced
  • statistical power to detect an effect of the factor is increased

Example dataset

Code
library(tidyverse)
rmdata <- read_csv(url("https://www.gribblelab.org/2812/data/rmdata.csv"),
                   col_types="fnnn")
rmdata
# A tibble: 10 × 5
   Subject    A1    A2    A3    A4
   <fct>   <dbl> <dbl> <dbl> <dbl>
 1 1           8    10     7     5
 2 2           9     9     8     6
 3 3           7     5     8     4
 4 4           9     6     5     7
 5 5           8     7     7     6
 6 6           5     4     4     3
 7 7           7     6     5     4
 8 8           8     8     6     6
 9 9           9     8     6     5
10 10          7     7     4     5
  • as an exercise let’s treat this dataset as a between-subjects design
Code
# convert from wide to long format
rmdata_long <- gather(rmdata, FactorA, DV, A1:A4, factor_key=TRUE)
# compute a between-subjects ANOVA
aov.bet <- aov(DV ~ FactorA, data=rmdata_long)
summary(aov.bet)
            Df Sum Sq Mean Sq F value  Pr(>F)   
FactorA      3   38.9  12.967   6.062 0.00189 **
Residuals   36   77.0   2.139                   
---
Signif. codes:  0 '***' 0.001 '**' 0.01 '*' 0.05 '.' 0.1 ' ' 1
  • what we’re missing out on is the fact that some of the total variance in the data is due to differences between the subjects
  • what if we were to include a second factor called Subject that coded for the subject number?
Code
aov.bet2 <- aov(DV ~ FactorA + Subject, data=rmdata_long)
summary(aov.bet2)
            Df Sum Sq Mean Sq F value   Pr(>F)    
FactorA      3   38.9  12.967  12.241 3.06e-05 ***
Subject      9   48.4   5.378   5.077 0.000471 ***
Residuals   27   28.6   1.059                     
---
Signif. codes:  0 '***' 0.001 '**' 0.01 '*' 0.05 '.' 0.1 ' ' 1
  • notice how the Sum Sq for Residuals is much smaller now
  • Mean Sq for Residuals (the “error term” for the ANOVA) is also much smaller
  • So our F value is much larger for Factor A

including Subjects reduces the ANOVA error term

  • 48.4 + 28.6 = 77.0

including Subjects reduces the ANOVA error term

  • 77.0 / 36 = 2.139
  • 28.6 / 27 = 1.059

including Subjects increases F

  • 12.967 / 2.139 = 6.062

  • 12.967 / 1.059 = 12.241

  • a more statistically powerful test of the effect of Factor A

  • more likely to detect a true difference

Repeated Measures ANOVA

our little experiment including Subjects as a factor:

            Df Sum Sq Mean Sq F value   Pr(>F)    
FactorA      3   38.9  12.967  12.241 3.06e-05 ***
Subject      9   48.4   5.378   5.077 0.000471 ***
Residuals   27   28.6   1.059                     
---
Signif. codes:  0 '***' 0.001 '**' 0.01 '*' 0.05 '.' 0.1 ' ' 1
  • this is in fact what repeated measures ANOVA does, essentially
  • it accounts for the differences in the DV across subjects,
  • and removes that variability from the error term

Repeated Measures ANOVA in R

  • the right way to do it (which becomes more important with multiple factors and more complex designs):
aov.rm <- aov(DV ~ FactorA + Error(Subject/FactorA), data=rmdata_long)
summary(aov.rm)

Error: Subject
          Df Sum Sq Mean Sq F value Pr(>F)
Residuals  9   48.4   5.378               

Error: Subject:FactorA
          Df Sum Sq Mean Sq F value   Pr(>F)    
FactorA    3   38.9  12.967   12.24 3.06e-05 ***
Residuals 27   28.6   1.059                     
---
Signif. codes:  0 '***' 0.001 '**' 0.01 '*' 0.05 '.' 0.1 ' ' 1

Repeated Measures ANOVA in R

aov.rm <- aov(DV ~ FactorA + Error(Subject/FactorA), data=rmdata_long)
summary(aov.rm)

Error: Subject
          Df Sum Sq Mean Sq F value Pr(>F)
Residuals  9   48.4   5.378               

Error: Subject:FactorA
          Df Sum Sq Mean Sq F value   Pr(>F)    
FactorA    3   38.9  12.967   12.24 3.06e-05 ***
Residuals 27   28.6   1.059                     
---
Signif. codes:  0 '***' 0.001 '**' 0.01 '*' 0.05 '.' 0.1 ' ' 1
  • Error(Subject/FactorA) is the way to tell the aov() function that FactorA is a within-subjects factor

Linear Models for Repeated Measures ANOVA

H_{1}: Y_{ij} = \mu + \alpha_{j} + \pi_{i} + \varepsilon_{ij}
H_{0}: Y_{ij} = \mu + \pi_{i} + \varepsilon_{ij}

  • Y_{ij} is the value of the DV for the ith subject at the jth level of the repeated measures factor
  • \mu is the grand mean of the entire dataset across all subjects and all levels of the repeated measures factor
  • \alpha_{j} is the effect of the jth level of the repeated measures factor
  • \pi_{i} is the effect of the ith subject
  • \varepsilon_{ij} is the unexplained varability in the ith subject at the jth level of the repeated measures factor

Linear Models for Repeated Measures ANOVA

H_{1}: Y_{ij} = \mu + \alpha_{j} + \pi_{i} + \varepsilon_{ij}
H_{0}: Y_{ij} = \mu + \pi_{i} + \varepsilon_{ij}

  • full model (H_{1}) includes the effect of the factor (\alpha_{j}) AND the effect of subjects (\pi_{i})
  • restricted model (H_{0}) only includes effect of subjects (effect of factor is zero)
  • null hypothesis H_{0} is that the factor \alpha_{j} has no effect on the DV; the only things that affect the DV are inter-subject differences \pi_{i} and random variability \varepsilon_{ij}

Assumptions of Repeated Measures ANOVA

  • random sampling from the population
  • independence of subjects
  • normality ^{*}
  • no extreme outliers ^{*}
  • homogeneity of treatment-difference variances ^{*}
    • also called “sphericity”
    • the variances of the differences between all pairwise combinations of groups are equal

Normality

  • some say it’s better to perform tests on each level of the RM factor
library(rstatix) # for shapiro_test()
rmdata_long %>%
    group_by(FactorA) %>%
    shapiro_test(DV)
# A tibble: 4 × 4
  FactorA variable statistic     p
  <fct>   <chr>        <dbl> <dbl>
1 A1      DV           0.871 0.102
2 A2      DV           0.984 0.982
3 A3      DV           0.918 0.341
4 A4      DV           0.952 0.691
library(ggpubr) # for ggqqplot()
ggqqplot(rmdata_long, "DV", facet.by="FactorA")

Extreme Outliers

  • we can use the identify_outliers() function from the rstatix package
library(rstatix) # for identify_outliers()
rmdata_long %>%
    group_by(FactorA) %>%
    identify_outliers(DV)
[1] FactorA    Subject    DV         is.outlier is.extreme
<0 rows> (or 0-length row.names)
  • 0 rows = empty list so no outliers

Sphericity

  • homogeneity of treatment-difference variances
  • the variances of the differences between all pairwise combinations of groups are equal
  • Mauchly’s Test is the most common test for sphericity

Sphericity

  • if we use the ezANOVA() function from the ez package to perform our repeated measures ANOVA instead of the aov() function, we will automatically get:
    • results of Mauchly’s test of sphericity
    • Greenhouse-Geisser corrected F value and p value

Greenhouse-Geisser Correction

  • estimates epsilon (a metric of sphericity)
  • if sphericity is violated, epsilon is < 1.0
  • denominator df for the F-ratio is corrected (lowered) by multiplying with epsilon
  • F-ratio is recomputed using corrected df
  • some prefer the “Huynh–Feldt correction” which is slightly less conservative when sphericity is violated only slightly
  • ezANOVA() function shows both GG and HF corrected F and p values

Repeated Measures ANOVA in R using ezANOVA()

Code
library(ez)
rm.anova <- ezANOVA(data=rmdata_long, dv=DV, wid=Subject, within=FactorA)
rm.anova
$ANOVA
   Effect DFn DFd        F            p p<.05       ges
2 FactorA   3  27 12.24126 3.059801e-05     * 0.3356342

$`Mauchly's Test for Sphericity`
   Effect         W         p p<.05
2 FactorA 0.3461323 0.1488387      

$`Sphericity Corrections`
   Effect       GGe        p[GG] p[GG]<.05       HFe        p[HF] p[HF]<.05
2 FactorA 0.7426009 0.0002387789         * 0.9981017 3.106252e-05         *
  • ezANOVA() is a wrapper around aov() that makes it easier to do repeated measures (and mixed repeated-between) ANOVA
  • it computes Mauchly’s test of sphericity
  • and shows both GG and HF corrected F and p values

Repeated Measures ANOVA in R using ezANOVA()

Code
library(ez)
rm.anova <- ezANOVA(data=rmdata_long, dv=DV, wid=Subject, within=FactorA)
rm.anova
$ANOVA
   Effect DFn DFd        F            p p<.05       ges
2 FactorA   3  27 12.24126 3.059801e-05     * 0.3356342

$`Mauchly's Test for Sphericity`
   Effect         W         p p<.05
2 FactorA 0.3461323 0.1488387      

$`Sphericity Corrections`
   Effect       GGe        p[GG] p[GG]<.05       HFe        p[HF] p[HF]<.05
2 FactorA 0.7426009 0.0002387789         * 0.9981017 3.106252e-05         *
  • Some say one should always use the (GG or HF) corrected F and p values, because sphericity is never perfect (never exactly 1.0)
  • the corrections are graded—the less/more sphericity is violated, the more the correction
  • so the corrected F and p values are always more ‘correct’ than the uncorrected ones

Post-hoc tests

  • just like before with between-subjects ANOVA we can use emmeans() and pairs()
library(emmeans) # for emmeans() and pairs()
rm.anova <- aov(DV ~ FactorA + Error(Subject/FactorA), data=rmdata_long)
mm <- emmeans(rm.anova, specs = ~ FactorA)
pairs(mm, adjust = "holm")
 contrast estimate   SE df t.ratio p.value
 A1 - A2       0.7 0.46 27   1.521  0.1399
 A1 - A3       1.7 0.46 27   3.693  0.0040
 A1 - A4       2.6 0.46 27   5.649  <.0001
 A2 - A3       1.0 0.46 27   2.173  0.1163
 A2 - A4       1.9 0.46 27   4.128  0.0016
 A3 - A4       0.9 0.46 27   1.955  0.1219

P value adjustment: holm method for 6 tests 

Disadvantages of Repeated Measures ANOVA

  • order effects
  • e.g. a neuroscientist wants to compare the effects of placebo vs drug A vs drug B on aggressiveness in monkeys
  • every pair of monkeys will be observed three times, once for each condition
  • how should we design the study?
  • one possibility: placebo day 1 then drug A day 2 then drug B day 3
  • bad idea: confounds potential drug effects with effect of time
  • maybe monkeys become less aggressive over time

Counterbalancing

  • one solution is to counterbalance the order of the conditions
  • some get [placebo day 1] -> [drug A day 2] -> [drug B day 3]
  • others get [placebo day 1] -> [drug B day 2] -> [drug A day 3]
  • we can do statistical tests to see if the order of the conditions matters
    • e.g. by coding the order of the conditions as a between-subjects factor in the ANOVA

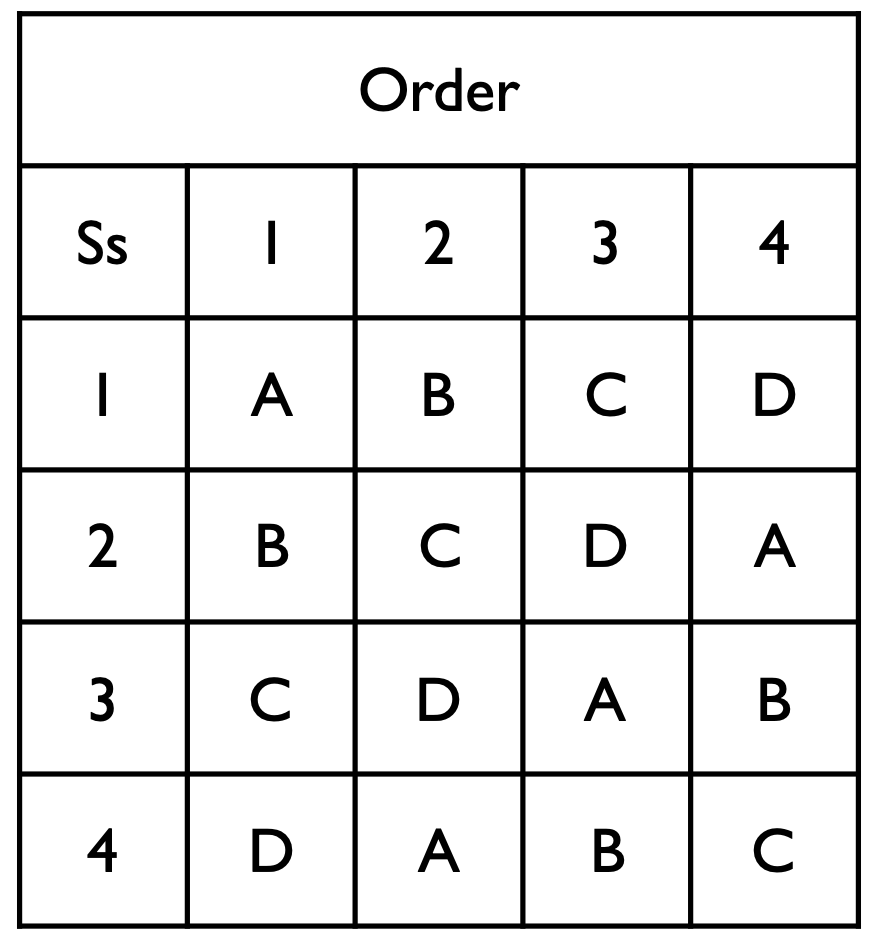
Latin Square Designs

  • but what if we have multiple levels of the within-subjects factor, e.g. A,B,C,D
  • many possible counterbalancing schemes (24 of them for 4 levels!)
  • not feasible to repeat our experiment with all of them
  • a Latin Square design is a way to counterbalance the order of the conditions in a principled way
  • every condition is presented exactly once in each row and column

Latin Square Designs

Differential Carryover Effects

  • a nasty problem with repeated measures designs
  • placebo -> drug A -> drug B
  • what if the drug A has a carryover effect that influences the DV in the drug B condition?
  • and
  • what if that is different than the carryover effect of drug B onto the DV in the drug A condition?
  • counterbalancing or Latin Squares will not help us here

Differential Carryover Effects

  • we could introduce a long “washout” period after one drug to let enough time elapse to eliminate the carryover effect
  • can’t always be done, some carryover effects are permanent
    • (e.g. lesions, or some drugs, or learning & memory experiments)
  • some scientific questions are better suited to between-subjects designs

Other ANOVA designs

  • Mixed ANOVA: combination of between- and within-subjects factors
  • sometimes called “Split-Plot ANOVA”
  • e.g. factor A is “time” and has three levels, (day 1, day 2, day 3)
  • factor B is “drug” and has two levels (placebo, drug A)
  • DV is “aggressiveness” of a monkey
  • each monkey is randomly assigned to either placebo or drug A
  • each monkey is observed three times, once for each level of time
  • this is a mixed ANOVA design
    • “time” is a within-subjects factor
    • “drug” is a between-subjects factor

Other ANOVA designs

  • ANCOVA: Analysis of Covariance
  • ANOVA + a continuous variable as a “covariate”
  • often used to “control for” a nuisance variable that is correlated with the DV
  • e.g. we want to know if drug A has an effect on aggressiveness
  • maybe aggressiveness is known to vary with monkey size (weight)
  • we could add monkey weight as a covariate to the model
  • allows us to test the effect of the drug on aggressiveness after we have removed any differences in aggressiveness than can be accounted for by differences in monkey weight

Other ANOVA designs

  • MANOVA: Multivariate Analysis of Variance
  • ANOVA with multiple DVs
  • allows us to test for effects of one or more factors across multiple DVs at the same time, in a principled way that takes into account the multiple comparisons problem
  • also accounts for correlation between the different DVs

Other ANOVA designs

  • MANCOVA: Multivariate Analysis of Covariance
  • plus any other combo you can think of!
  • you can have any combination of within-subjects factors, between-subjects factors, covariates, multiple DVs, etc.
  • they are all just linear models with different combinations of predictors
    • predictors can be continuous (e.g. a covariate)
    • predictors can be categorical (e.g. a between-subjects or within-subjects factor)
    • interactions between predictors are also in the model

Linear Mixed Effects Models

  • a generalization of ANOVA that allows us to model more complex designs
  • handles unbalanced designs and missing data much better than traditional ANOVA
  • can be used to model repeated measures designs
  • nested designs (e.g. children within classrooms within schools within school districts)

Go Forth And Do Science!

  • we have focused on concepts and main principles
  • we have not covered every tiny detail
  • all the complex approaches/models you will learn about next are just extensions of the basic concepts we have covered here
  • remember often there are different approaches
  • try to understand the tradeoffs, and choose for yourself
  • Data is currency in science
  • Good data comes from good experimental designs
  • Have fun!