Welcome
Week 1
R/RStudio books
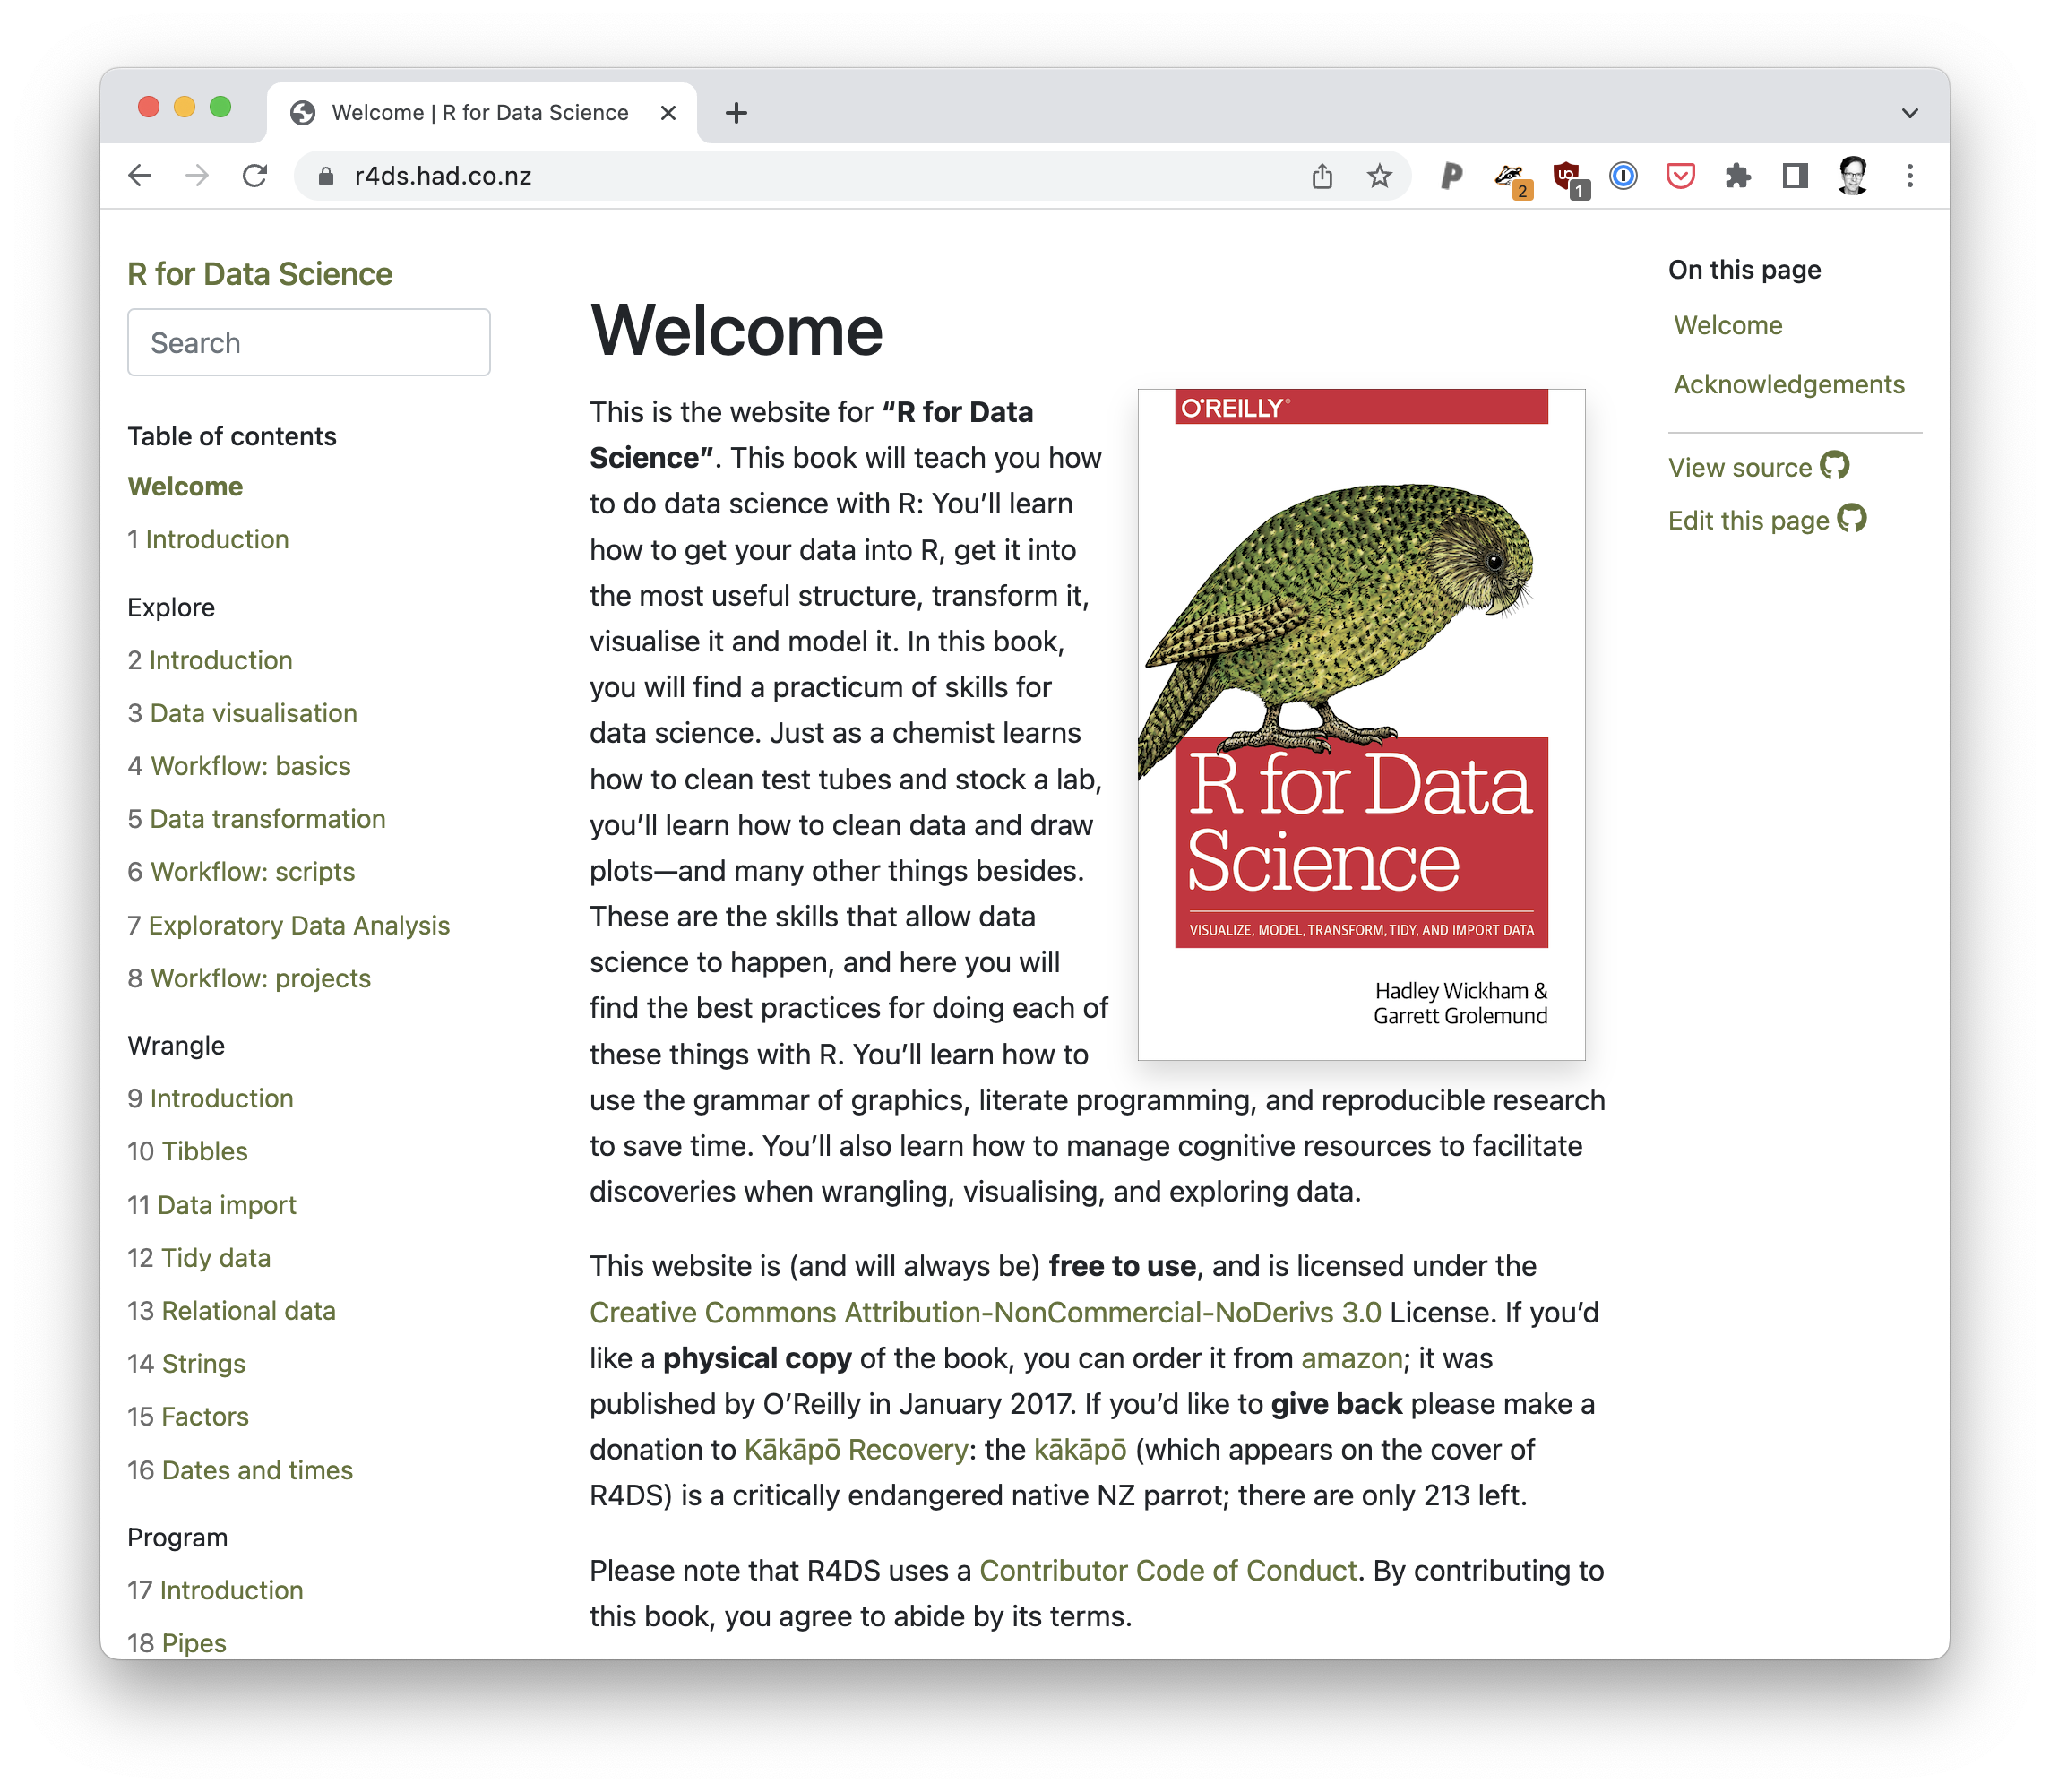
- R for Data Science
by Hadley Wickham & Garrett Grolemund
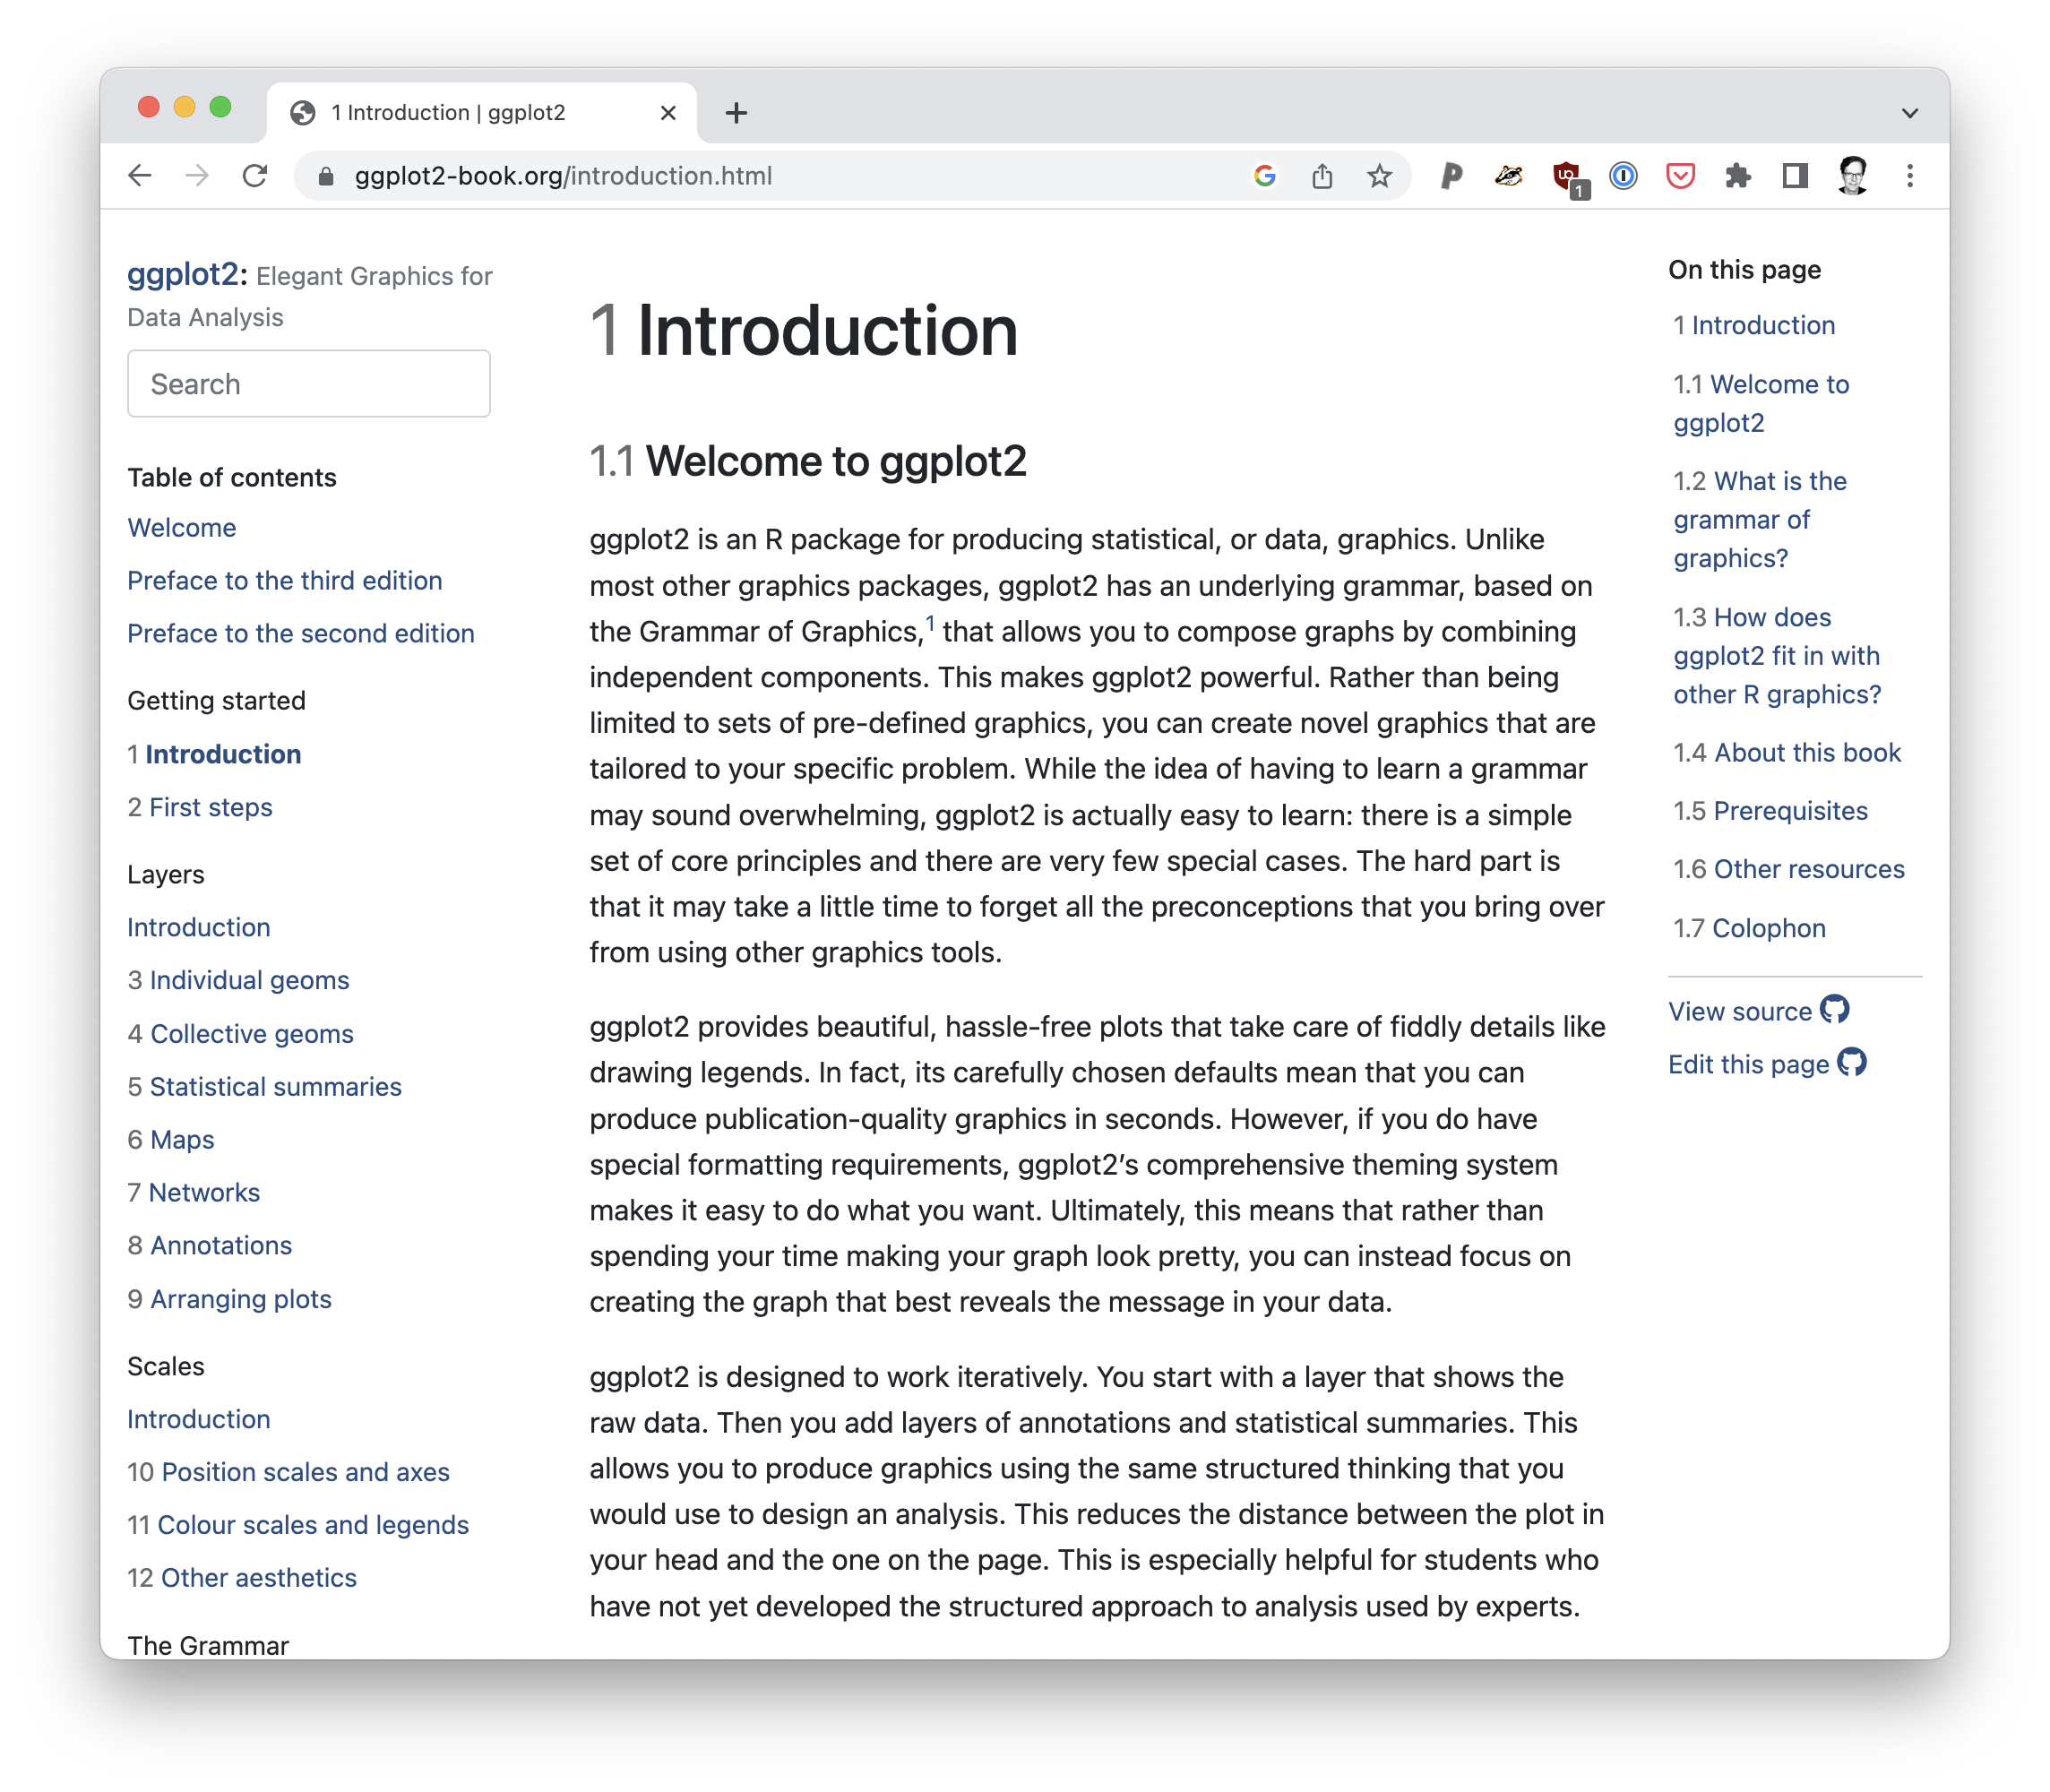
- ggplot2: Elegant Graphics for Data Analysis
by Hadley Wickham
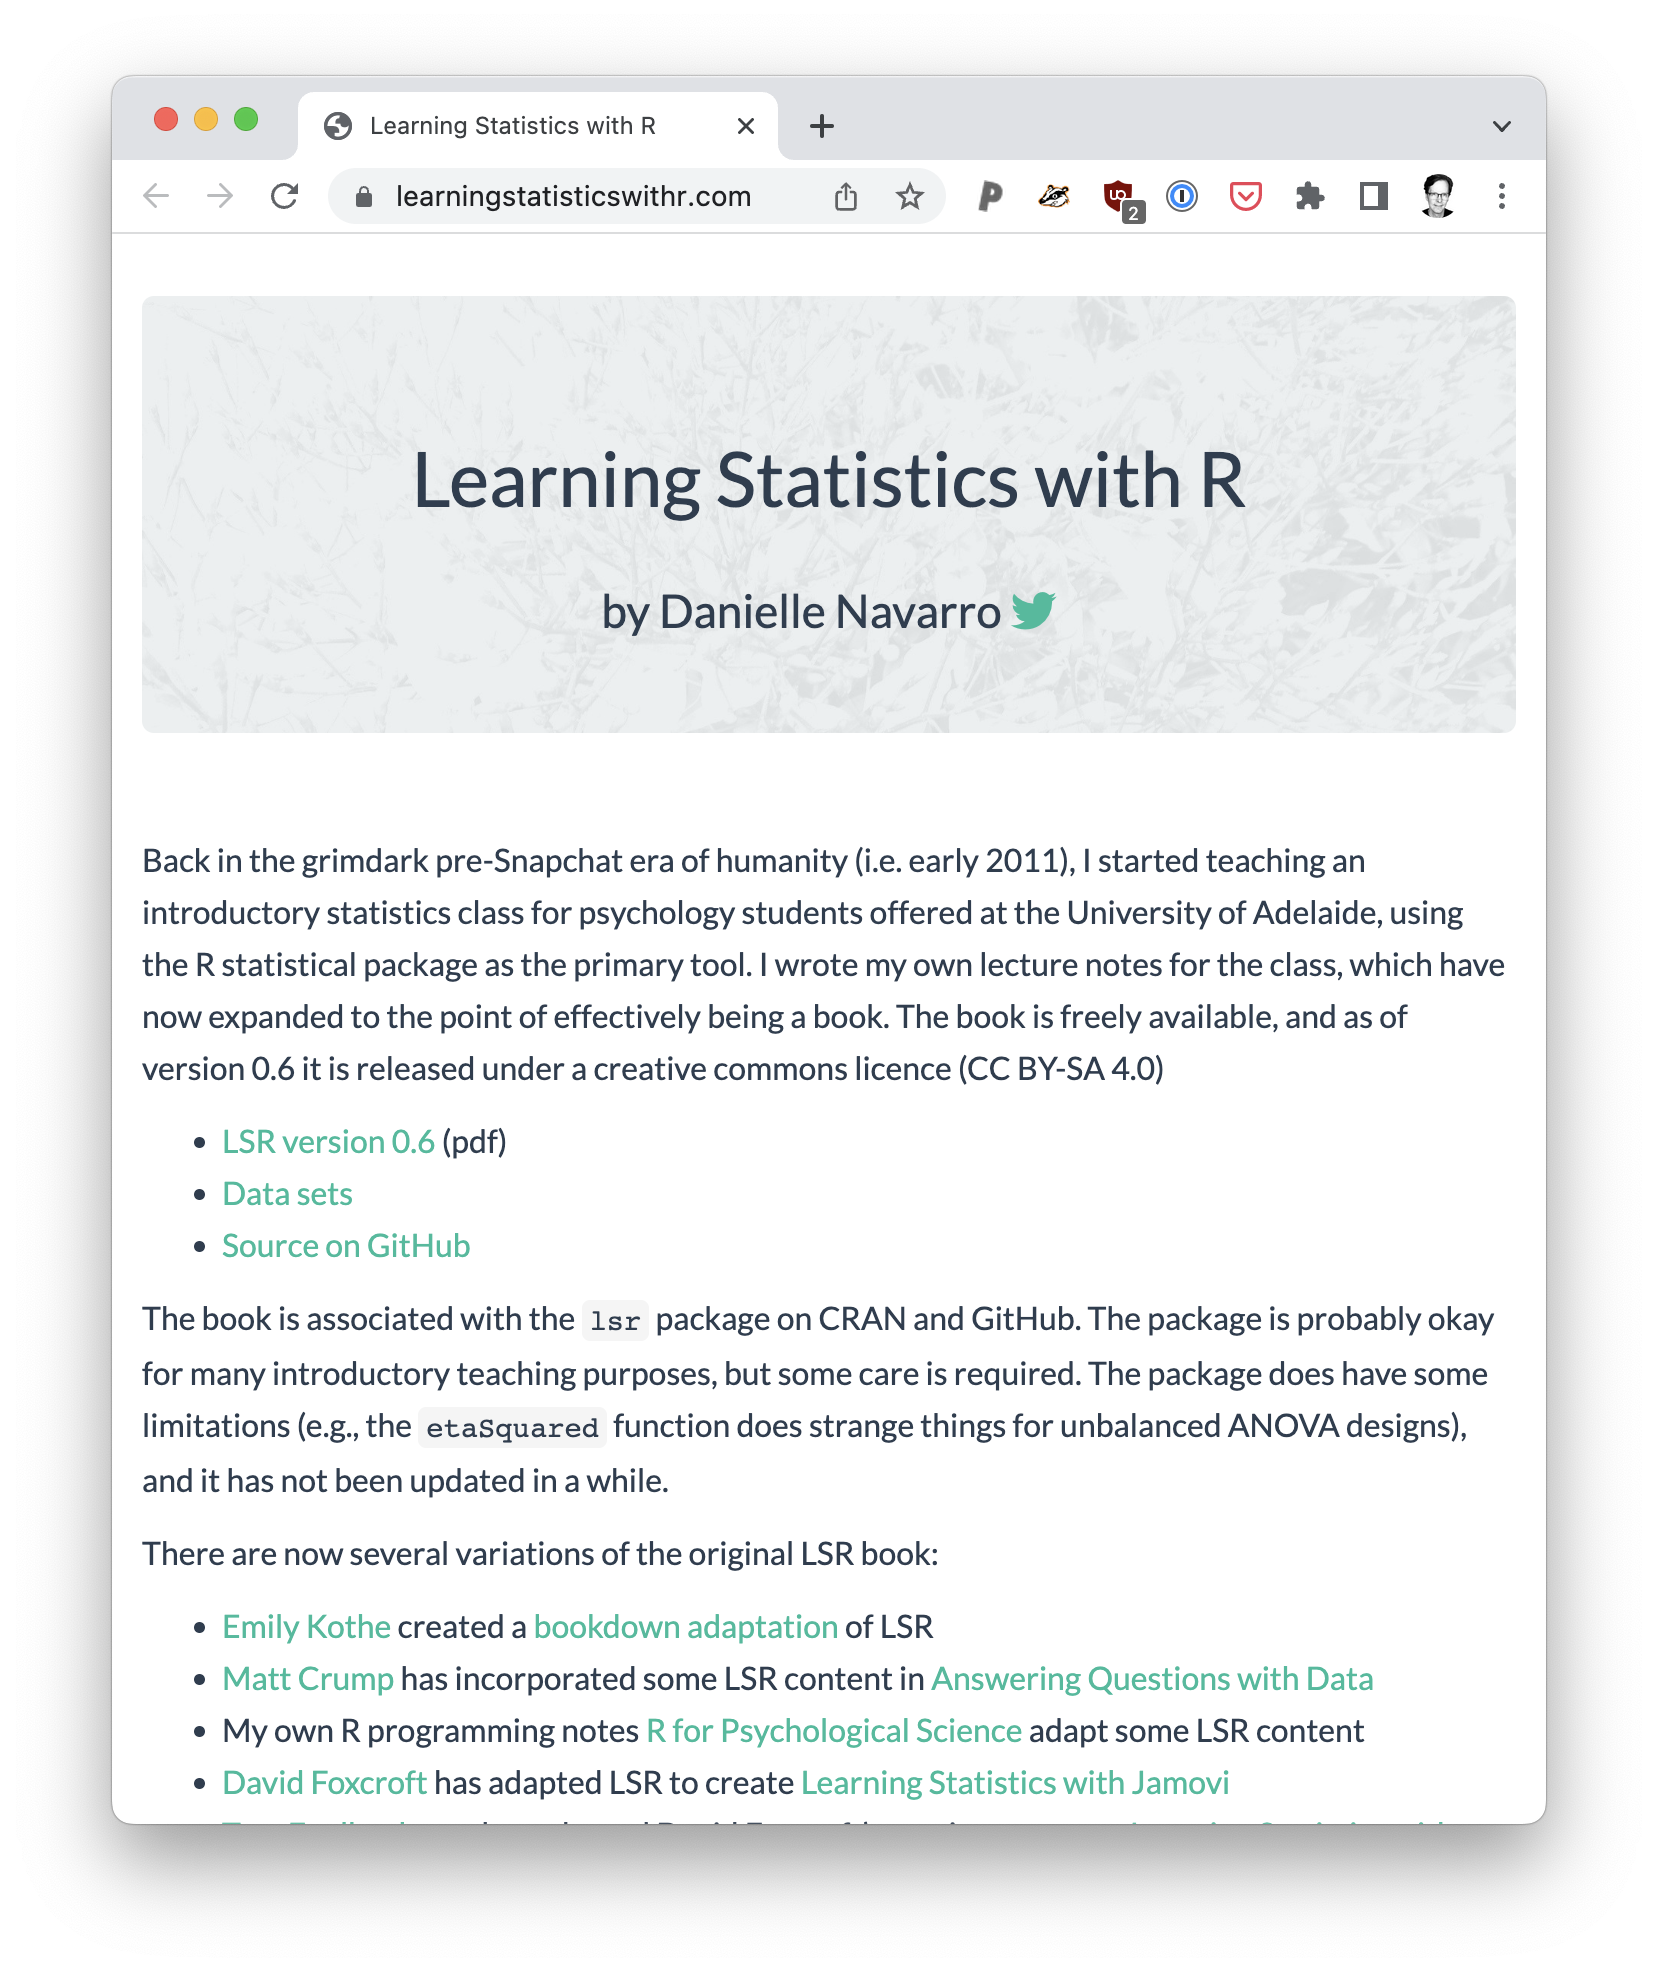
Statistics books
by Matthew J. C. Crump, Danielle J. Navarro, & Jeffrey Suzuki
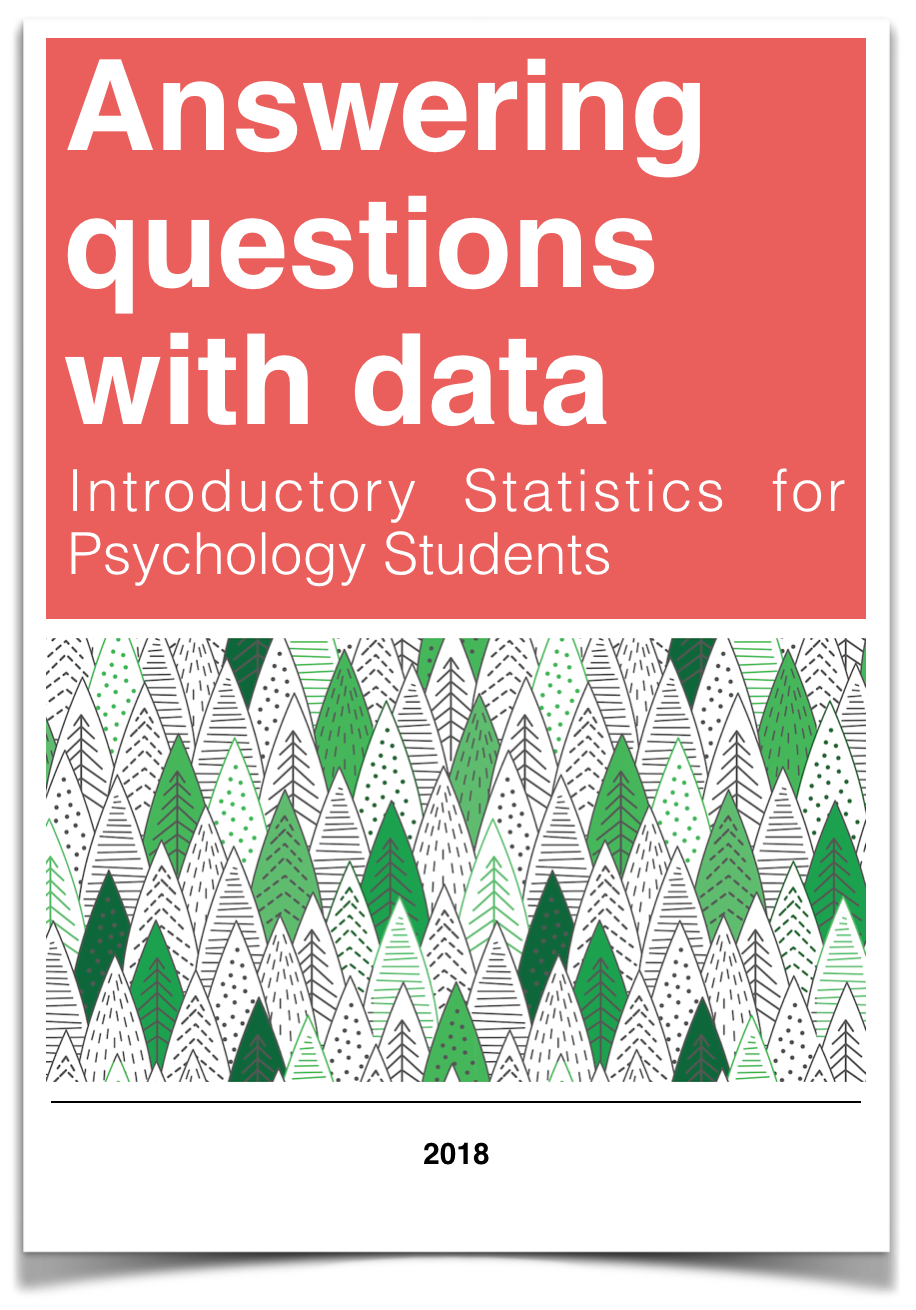
Statistics books
R
- https://www.r-project.org
- statistical computing language
- free & open-source
- available for macOS, Windows, GNU/Linux
- download here

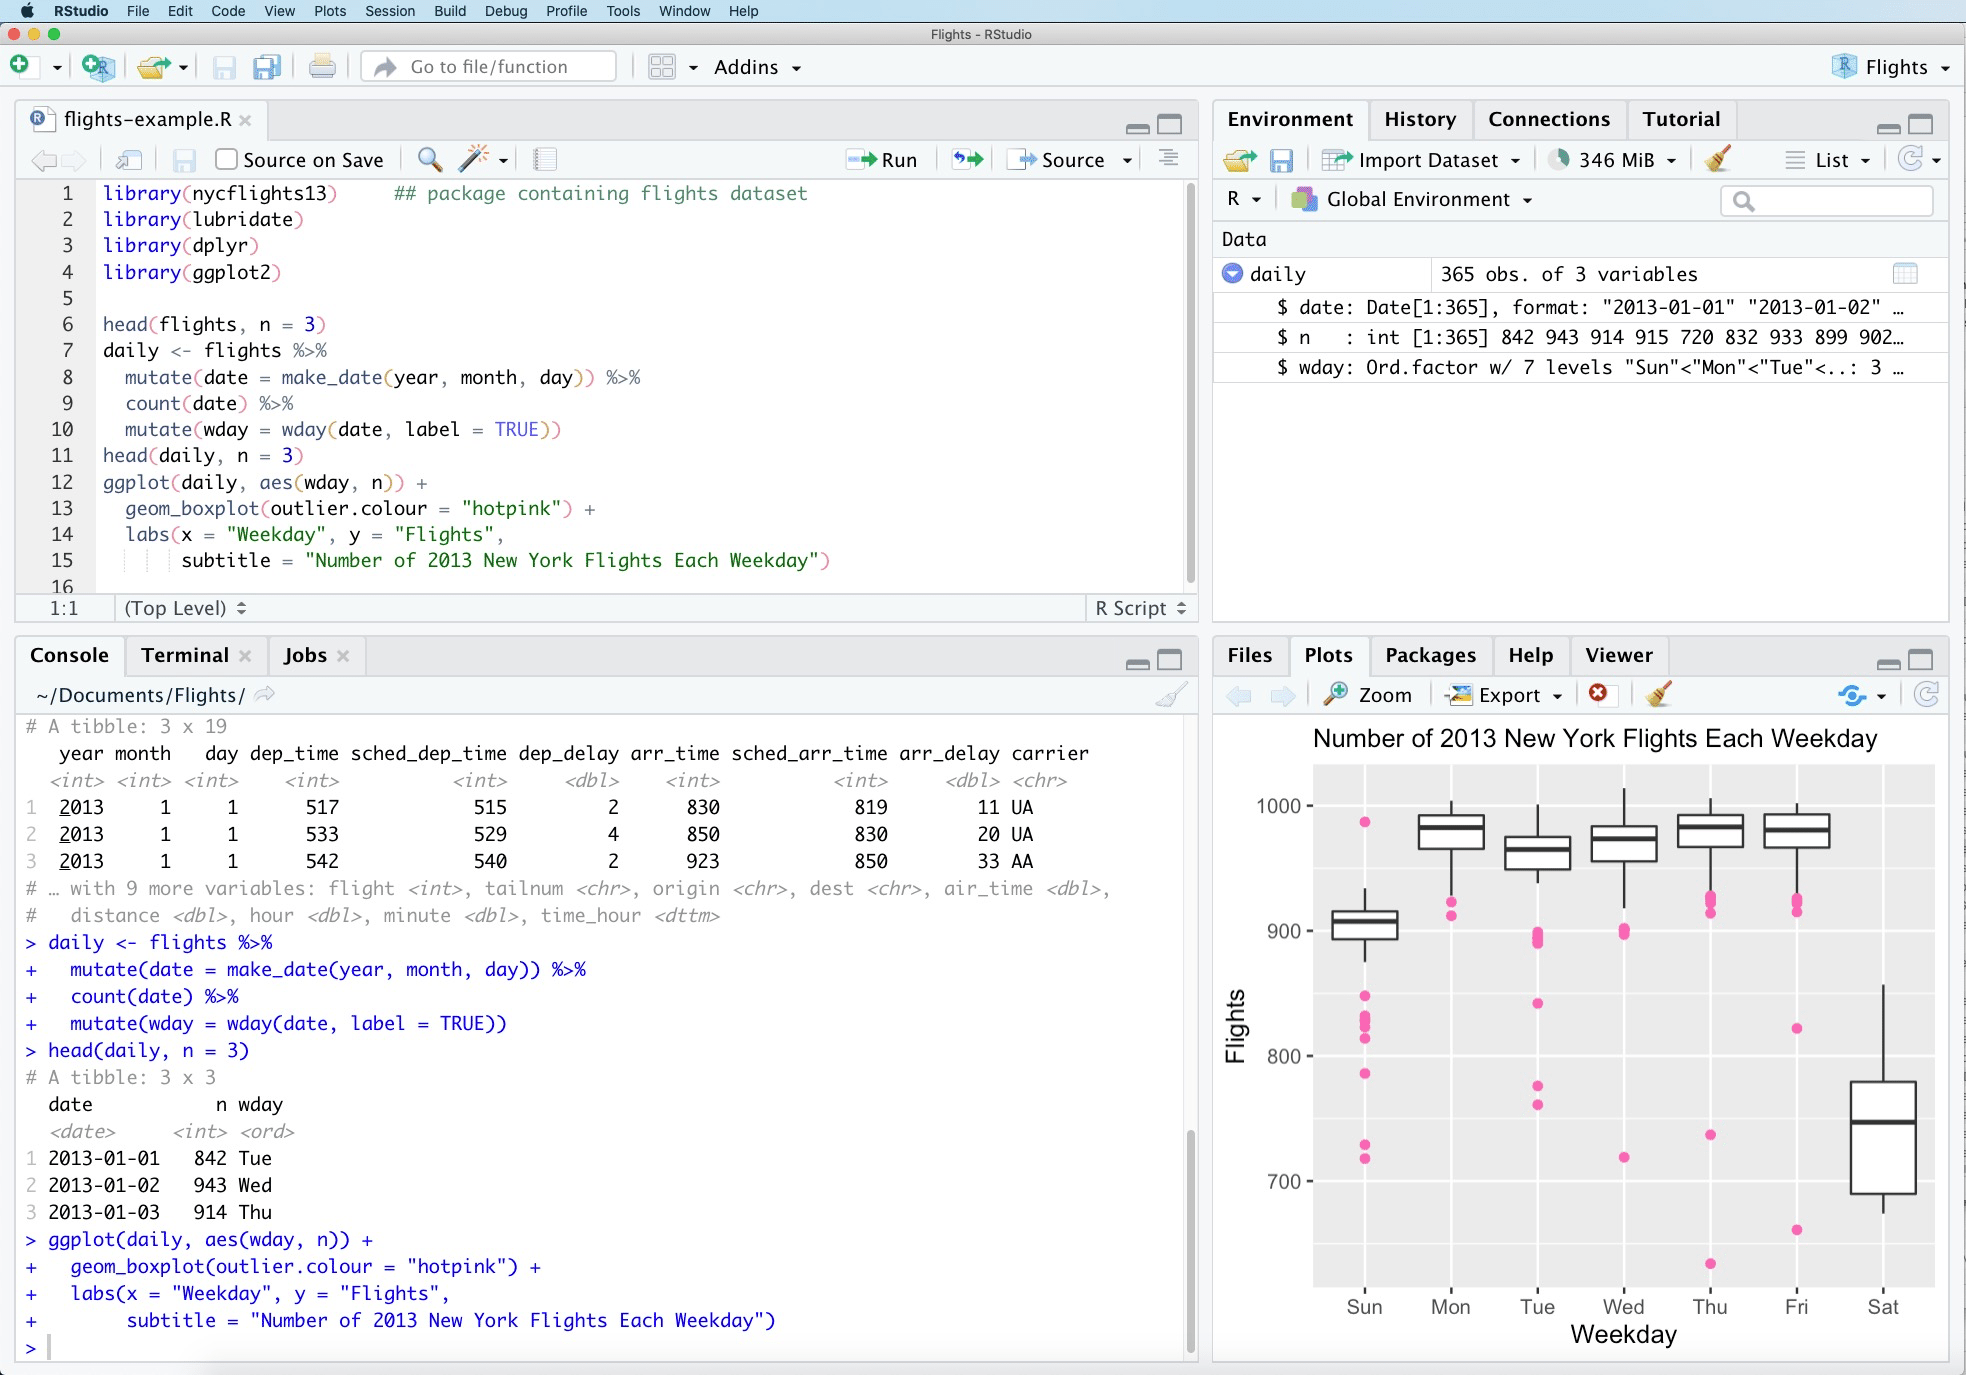
RStudio
- RStudio
- integrated development environment (IDE) for R
- free & open-source
- available for macOS, Windows, GNU/Linux
- download here
![]()
Syllabus
- Full details about the course policies & procedures can be found in the course syllabus
- syllabus can be found on OWL and on the course website
- read the syllabus
Course Webpage
- assigned readings
- lecture slides
- homework assignments