Weekly homework assignments are comprised of two components: a Lab Component that your TA will guide you through in the weekly lab session, and a Home Component that you are to complete on your own. You must hand in both components. Both will count towards your grade.
Submit homework on OWL by 5:00 pm London ON time on the date shown in the Class Schedule.
Submit your homework assignment as a single RMarkdown file, using your last name and the homework assignment as a filename in the following format: gribble_n.Rmd where n is the homework assignment number.
Here is the R Markdown template file for this assignment: lastname_10.Rmd.
Lab Component
1. Load the data
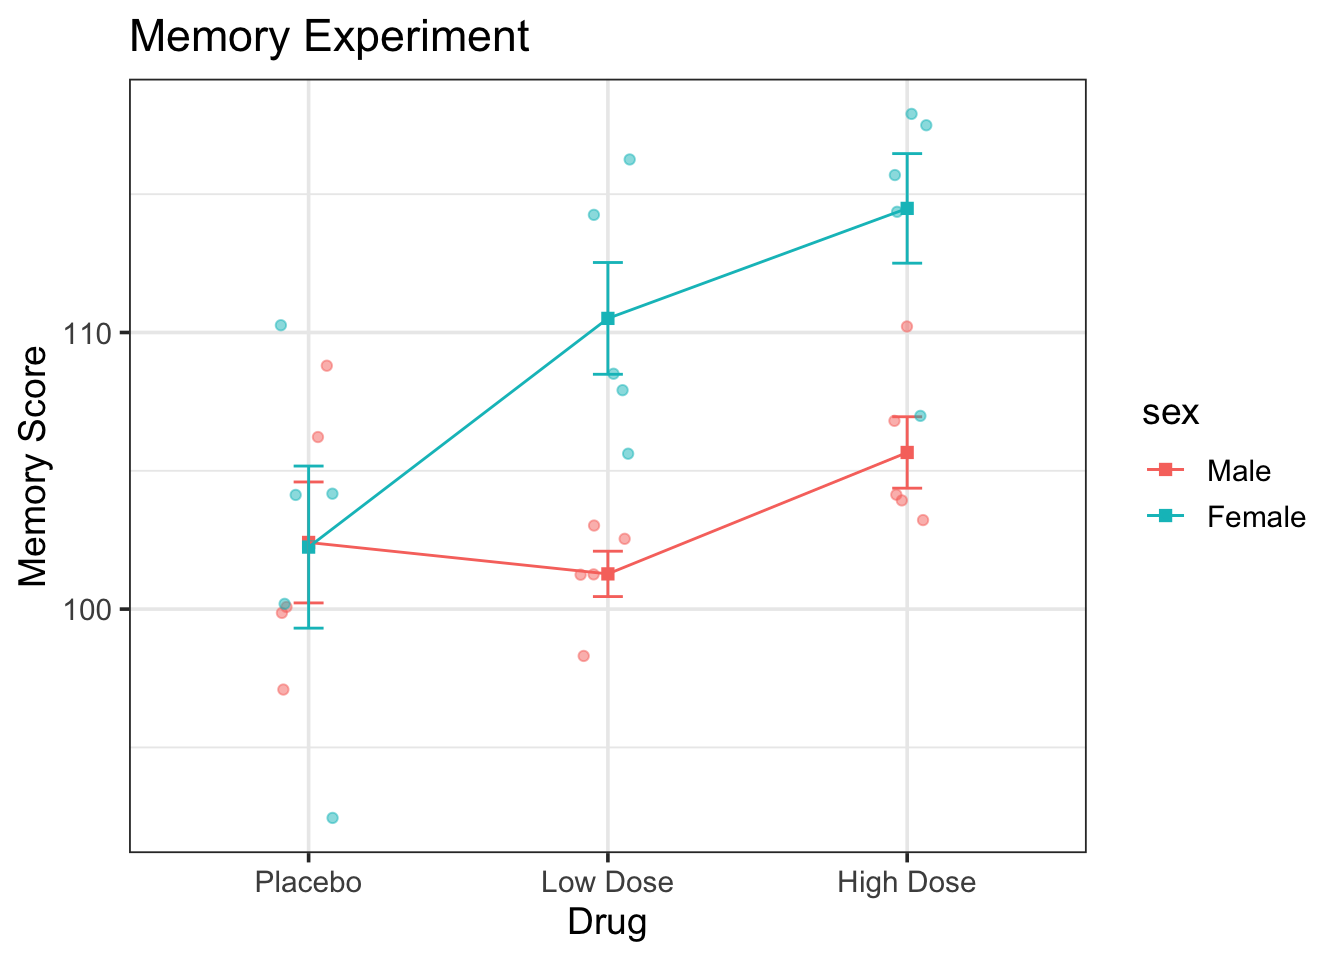
We will be working on a fictitious dataset in which male and female mice were tested on spatial memory after receiving either a saline placebo, a low dose of the (fictitious) drug memzipan, or a high dose of memzipan. Thus this is a two-factor between subjects design with drug as one factor with three levels (placebo, low dose, high dose) and sex as a second factor with two levels (male, female). The dependent variable is memory score, higher values are better. The researcher was interested in whether memzipan improves memory and whether it may have different effects for male versus female mice.
Load the data, making sure that the two columns coding the drug and sex factors are indeed loaded as factors not strings. This can be done by passing the read_csv() function an argument col_types="nff" where n indicates that the first column should be loaded as numeric, f indicates that the second and third columns should be loaded as factors. You can read more about this argument in the read_csv() documentation here: https://readr.tidyverse.org/reference/read_csv.html.
Compute some summary statistics for each of the 6 groups of mice. You can use group_by() and summarize() to do this. Include the mean, the number of observations, and the standard error of the mean.
# A tibble: 6 × 5
# Groups:   drug [3]
  drug      sex    meanmem    se     n
  <fct>     <fct>    <dbl> <dbl> <int>
1 Placebo   Male      102. 2.19      5
2 Placebo   Female    102. 2.93      5
3 Low Dose  Male      101. 0.820     5
4 Low Dose  Female    111. 2.02      5
5 High Dose Male      106. 1.29      5
6 High Dose Female    114. 1.98      5
3. Produce a plot
Produce a plot of your choosing showing the means of each of the 6 groups. Organize your plot in a way that makes it intuitive to interpret. Include a title and axis labels. Include a legend if appropriate. Here is a sample plot but this is only one possible way to organize the data. You can produce a plot of your choosing as long as it makes sense for interpreting the data.
4. Perform a 3x2 factorial ANOVA
Perform a 3x2 factorial ANOVA on the data. Use the aov() function. Include the output of the summary() function. Write a sentence or two interpreting the results of the ANOVA output.
            Df Sum Sq Mean Sq F value  Pr(>F)
drug         2  300.8  150.42   7.613 0.00275 **
sex          1  266.8  266.77  13.502 0.00119 **
drug:sex     2  141.2   70.61   3.574 0.04380 *
Residuals   24  474.2   19.76
---
Signif. codes:  0 '***' 0.001 '**' 0.01 '*' 0.05 '.' 0.1 ' ' 1
5. Follow-up tests
Write a few sentences to explain what your approach will be for conducting follow-up tests, based on the ANOVA output above in question 4. Which specific tests will you conduct and why? What will your approach be for controlling Type-I error? In the Home Component below you will actually conduct the follow-up tests.
Home Component
6. Check ANOVA assumptions
Oops! We forgot to check ANOVA assumptions. Check the normality assumption and the homogeneity of variance assumptions for the data. Use the shapiro.test() function to check the Normality assumption, and also produce a Q-Q plot. Use the leveneTest() function to check the homogeneity of variance assumption. Write a sentence or two interpreting the results of the tests.
7. Follow-up tests
Conduct and interpret the follow-up tests that you described in question 5 above. Also write a sentence or two with your “conclusions” about the data with respect to the original scientific question(s) that the researcher had.
8. Effect Size
Compute a measure of effect size for the effect of memzipan on memory in female mice. Write a sentence or two interpreting the effect size that you compute.
9. Power analysis
The researcher notices that the effect of high dose memzipan on memory score in male mice appears small but perhaps non-zero, and they want to design a focused follow-up experiment to try to better test whether high dose memzipan in male mice improves memory.
Conduct a power analysis for a t-test in which placebo and high dose memzipan will be tested in male mice, to determine how many mice per group the researcher would need to achieve 80% power to detect differences between means as large as the difference between means they obtained in the data above for high dose vs placebo in male mice. You can use the power.t.test() function in R. To estimate delta you can use the difference between means of the male placebo and male high dose groups. To estimate the sd parameter you can average the standard deviations of the male high dose and the male placebo groups. Assume a sig.level of 0.05. Justify whether you should use a one-sided or two-sided test in your power calculation.