  mpg cylinders displacement horsepower weight acceleration year origin
1  18         8          307        130   3504         12.0   70      1
2  15         8          350        165   3693         11.5   70      1
3  18         8          318        150   3436         11.0   70      1
4  16         8          304        150   3433         12.0   70      1
5  17         8          302        140   3449         10.5   70      1
6  15         8          429        198   4341         10.0   70      1
                       name
1 chevrolet chevelle malibu
2         buick skylark 320
3        plymouth satellite
4             amc rebel sst
5               ford torino
6 ford galaxie 500Homework 4
Psychology 2812B FW22
Weekly homework assignments are comprised of two components: a Lab Component that your TA will guide you through in the weekly lab session, and a Home Component that you are to complete on your own. You must hand in both components. Both will count towards your grade.
Submit homework on OWL by 5:00 pm London ON time on the date shown in the Class Schedule.
Submit your homework assignment as a single RMarkdown file, using your last name and the homework assignment as a filename in the following format: gribble_n.Rmd where n is the homework assignment number.
Here is the R Markdown template file for this assignment: lastname_4.Rmd.
Lab Component
1. ISLR2 Auto dataset
Load the tidyverse.
Install and load the ISLR2 package and inspect the dataset called Auto:
2. Plot car’s weight versus fuel efficiency
Plot each car’s weight (pounds) against its fuel efficiency (mpg) (miles per gallon of fuel) and overlay a linear fit using geom_smooth(method="lm", se=FALSE):
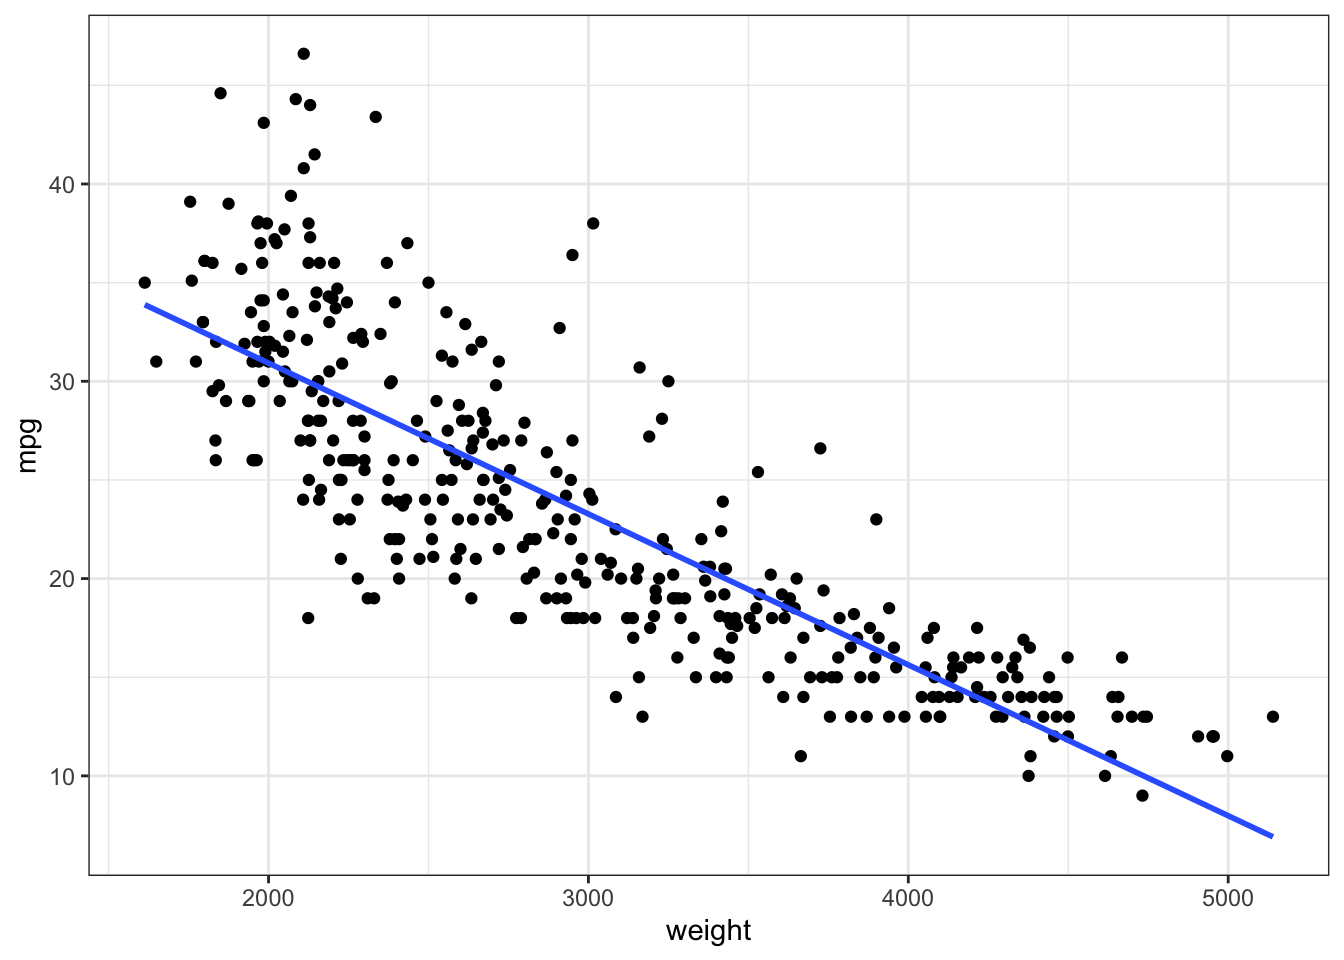
3. Correlation coefficient
Compute the correlation (Pearson’s R) between weight and mpg:
[1] -0.83224424. Re-plot with \(R\) shown on Figure
Re-plot the data and show the correlation coefficient on the plot.
Hint: the stat_correlation() function in the ggpmisc package can do this easily (you may have to install.packages("ggpmisc")).
Hint2: you can also add a line using the stat_poly_line(se=FALSE) function (or you can do like before and use the geom_smooth(method="lm", se=FALSE) function, your choice):

Home Component
5. Interpretation & Inference
Write a sentence or two describing the relationship between weight and mpg. Say something about the strength and the direction of the correlation.
Conduct a significance test of the correlation between weight and mpg using cor.test().
Check the normality assumption using shapiro.test().
Report the results of your tests.
If the normality assumption is violated, re-do the correlation significance test using Spearman’s rank correlation and report the results.
Based on your work so far write a sentence or two about whether you think a linear relationship exists (or not) and why (or why not).
6. Linear Regression model
Compute a linear regression model in which you predict mpg from weight. Use the lm() function in R to define your model. Then use the summary() function to display information about your regression model.
7. Model coefficients
What is the Y-intercept of your regression line?
What is the slope of your regression line?
Write a sentence that explains the meaning of the slope.