install.packages("nycflights13")Homework 3
Psychology 2812B FW22
Weekly homework assignments are comprised of two components: a Lab Component that your TA will guide you through in the weekly lab session, and a Home Component that you are to complete on your own. You must hand in both components. Both will count towards your grade.
Submit homework on OWL by 5:00 pm London ON time on the date shown in the Class Schedule.
Submit your homework assignment as a single RMarkdown file, using your last name and the homework assignment as a filename in the following format: gribble_n.Rmd where n is the homework assignment number.
Here is the R Markdown template file for this assignment: lastname_3.Rmd.
Lab Component
1. LGA mean departure delay
Load the tidyverse package and the nycflights dataset. Note that you will first need to install the nycflights13 dataset:
library(tidyverse)
library(nycflights13)
Write R code that outputs the average departure delay and the average arrival delay of flights originating from LGA (La Guardia airport). Hint: use the %>% pipe operator together with filter() (to select observations with origin equal to "LGA") and with summarise() to calculate the mean of dep_delay and the mean of arr_delay. Don’t forget to set na.rm=TRUE to remove missing values.
# A tibble: 1 × 2
  dep_delay_mean arr_delay_mean
           <dbl>          <dbl>
1           10.3           5.78
2. LGA departure delay by month
Write R code to calculate the mean arrival delay of flights originating from La Guardia airport for each month of the year.
# A tibble: 12 × 2
   month arr_delay_mean
   <int>          <dbl>
 1     1          3.38
 2     2          3.15
 3     3          3.74
 4     4         12.0
 5     5          2.80
 6     6         14.8
 7     7         14.2
 8     8          5.41
 9     9         -2.83
10    10          0.186
11    11          1.55
12    12         12.0
3. Worst carrier at LGA
Write R code to calculate the mean departure delay of flights originating from La Guardia airport, for each Airline (carrier), and sort the output from best to worst.
# A tibble: 13 × 2
   carrier dep_delay_mean
   <chr>            <dbl>
 1 US                3.31
 2 AA                6.71
 3 MQ                8.53
 4 9E                8.89
 5 DL                9.57
 6 OO               10.4
 7 UA               12.1
 8 B6               14.8
 9 WN               17.6
10 FL               18.7
11 YV               19.0
12 EV               19.1
13 F9               20.2
4. Airlines full names
Re-do question 3 above but instead of outputting the two letter carrier abbreviations, instead output the full name of each carrier (from the airlines data frame). Hint: see Chapter 13.4 Mutating joins for an example of how to join the airlines data frame to the flights data frame.
# A tibble: 13 × 2
   name                        dep_delay_mean
   <chr>                                <dbl>
 1 US Airways Inc.                       3.31
 2 American Airlines Inc.                6.71
 3 Envoy Air                             8.53
 4 Endeavor Air Inc.                     8.89
 5 Delta Air Lines Inc.                  9.57
 6 SkyWest Airlines Inc.                10.4
 7 United Air Lines Inc.                12.1
 8 JetBlue Airways                      14.8
 9 Southwest Airlines Co.               17.6
10 AirTran Airways Corporation          18.7
11 Mesa Airlines Inc.                   19.0
12 ExpressJet Airlines Inc.             19.1
13 Frontier Airlines Inc.               20.2
Home Component
5. Number of long delays
For all flights originating from La Guardia airport, calculate the number of flights for which the departure delay was greater than 60 minutes, for each carrier. Sort the output from best to worst and output the full name of each carrier. Hint: think about how you can modify your answer to question 4 above.
# A tibble: 13 × 2
   name                        delays60
   <chr>                          <int>
 1 SkyWest Airlines Inc.              3
 2 Frontier Airlines Inc.            73
 3 Mesa Airlines Inc.                79
 4 Endeavor Air Inc.                183
 5 AirTran Airways Corporation      314
 6 US Airways Inc.                  473
 7 Southwest Airlines Co.           500
 8 United Air Lines Inc.            579
 9 JetBlue Airways                  604
10 American Airlines Inc.           824
11 ExpressJet Airlines Inc.        1108
12 Envoy Air                       1149
13 Delta Air Lines Inc.            1351
6. Number of flights per airline
Of course the calculation in question 5 above is arguably unfair, as different airlines operate a different number of flights. Calculate the number of flights each airline operates out of La Guardia airport. Output from most to least, and include full carrier names.
# A tibble: 13 × 2
   name                        delays60
   <chr>                          <int>
 1 Delta Air Lines Inc.           23067
 2 Envoy Air                      16928
 3 American Airlines Inc.         15459
 4 US Airways Inc.                13136
 5 ExpressJet Airlines Inc.        8826
 6 United Air Lines Inc.           8044
 7 Southwest Airlines Co.          6087
 8 JetBlue Airways                 6002
 9 AirTran Airways Corporation     3260
10 Endeavor Air Inc.               2541
11 Frontier Airlines Inc.           685
12 Mesa Airlines Inc.               601
13 SkyWest Airlines Inc.             26
7. As a proportion
Re-do question 5 and compute the number of flights delayed greater than 60 minutes as a percentage (0-100) of the total number of flights each airline operates out of La Guardia. Output a table with the total number of flights, the number of delays greater than 60 minutes, and the number of delays greater than 60 minutes as a percentage (0-100) of the total number of flights. Sort from best to worst on the 3rd column (delays as a percentage of total number of flights).
# A tibble: 13 × 4
name total delayed60 delayed60_percent
<chr> <int> <int> <dbl>
1 US Airways Inc. 13136 473 3.60
2 American Airlines Inc. 15459 824 5.33
3 Delta Air Lines Inc. 23067 1351 5.86
4 Envoy Air 16928 1149 6.79
5 United Air Lines Inc. 8044 579 7.20
6 Endeavor Air Inc. 2541 183 7.20
7 Southwest Airlines Co. 6087 500 8.21
8 AirTran Airways Corporation 3260 314 9.63
9 JetBlue Airways 6002 604 10.1
10 Frontier Airlines Inc. 685 73 10.7
11 SkyWest Airlines Inc. 26 3 11.5
12 ExpressJet Airlines Inc. 8826 1108 12.6
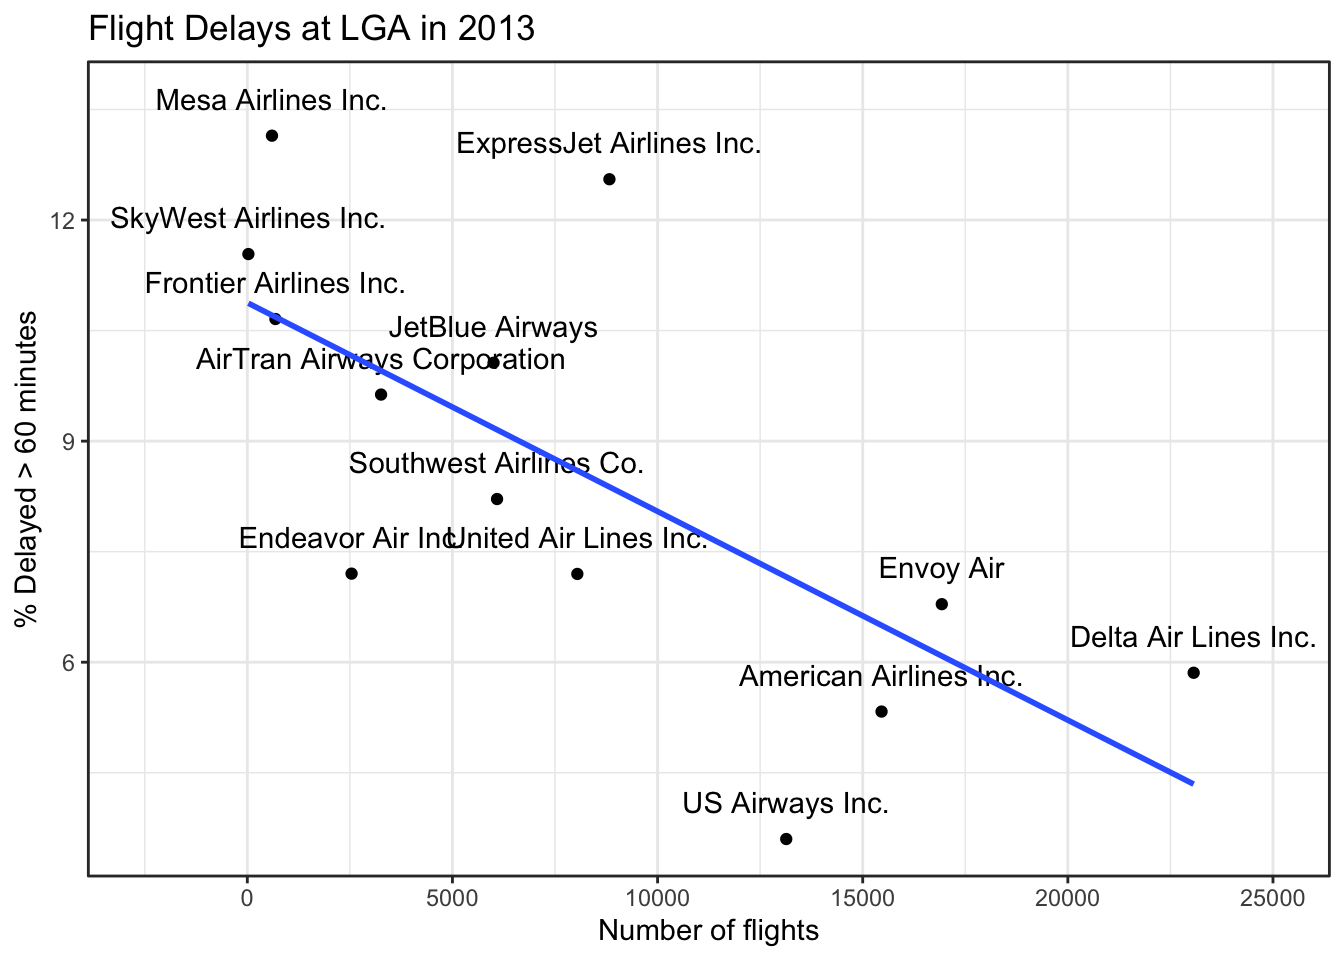
13 Mesa Airlines Inc. 601 79 13.1 8. Make a plot
Is there a relationship between the number of flights a carrier operates and the percentage of flights delayed more than 60 minutes? Make a scatterplot with total number of flights on the horizontal axis and percentage of delayed flights on the vertical axis. Add a linear fit but set se=FALSE to remove the shaded region representing the confidence interval. Use the theme_bw theme. Add a title and x and y labels as shown. Set the xlim() to (-2500,25000). Use geom_text() to plot the carrier names. Hint 1: in the aes() instruction where you specify x= and y= also specify label= as the name of the carrier. Then geom_text() knows what to plot. Hint 2: add a space between points and labels by adding nudge_y = 0.5 to the geom_text() instruction. Hint 3: avoid text labels being clipped outside of the range of the plot by adding a + coord_cartesian(clip = "off") instruction to the plot. BTW: these are things one can look up in the ggplot2 documentation, using google, etc.