Exercise 31
Spectrum
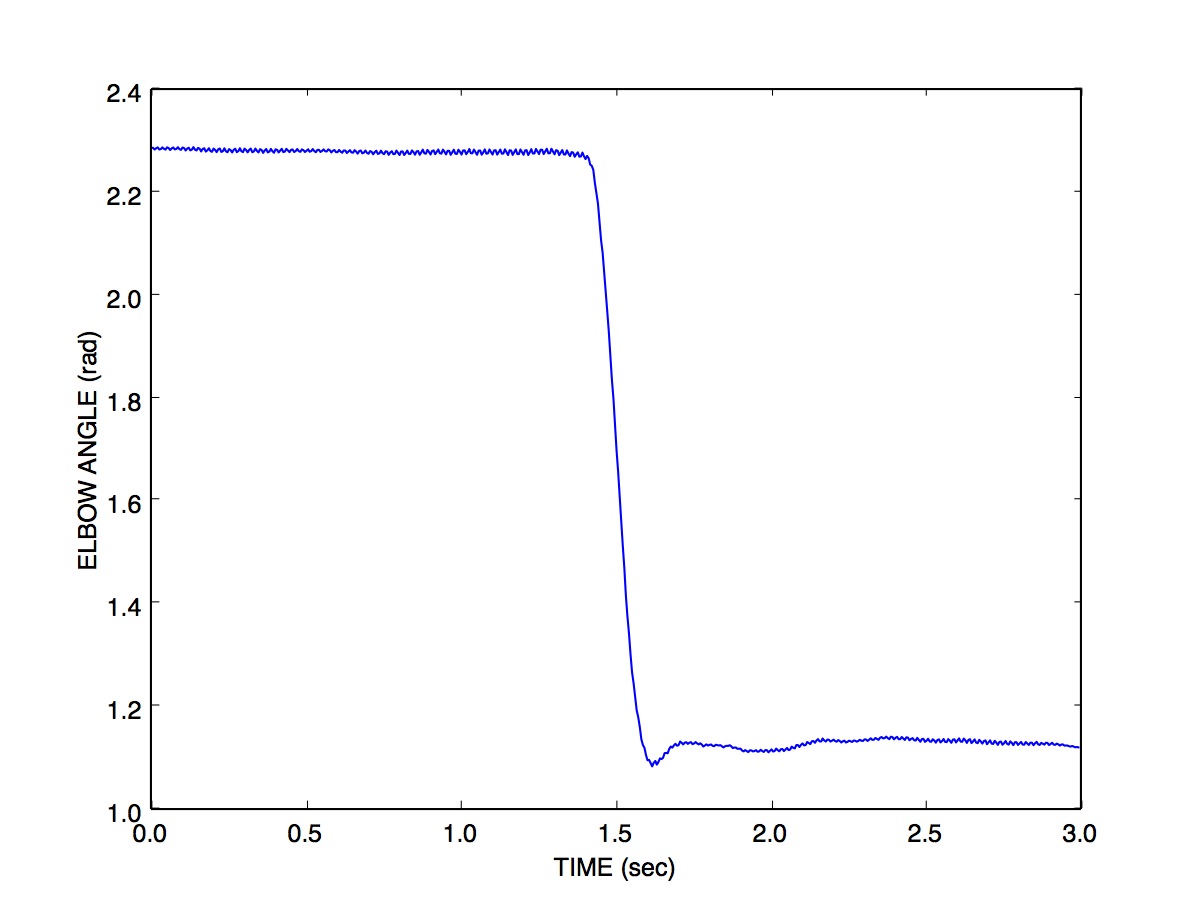
The file e31data.txt contains Optotrak measurements of a single-joint elbow rotation over time. The angle between the upper and lower arm (in radians) was sampled at 200 Hz. Here is a plot of the data file:
Answer the following questions about the data. Use whatever signal processing techniques you wish, to answer each question. Explain the signal processing steps you took, and why.
What is the Nyquist frequency?
Compute and plot the spectrum of the signal, showing what the signal power is at different frequencies.
What does the spectrum reveal about this signal?
