Exercise 25
Line of best fit
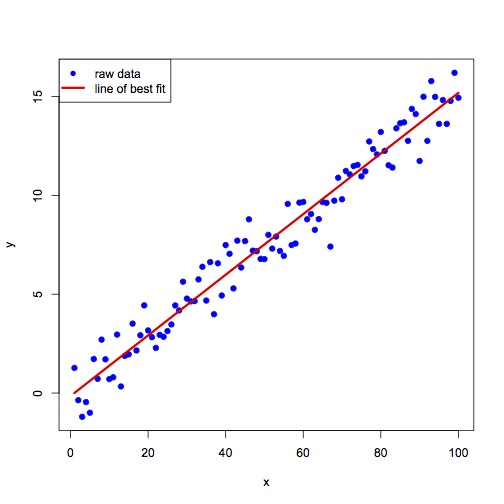
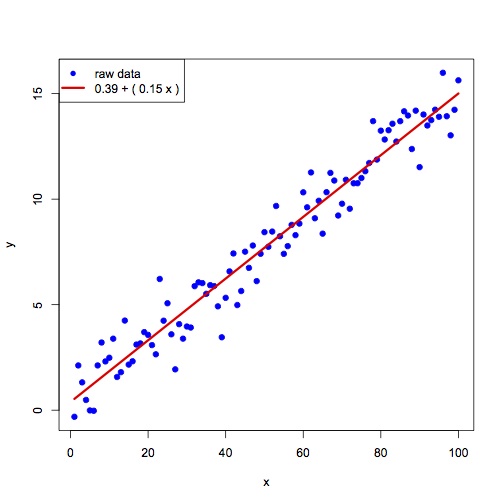
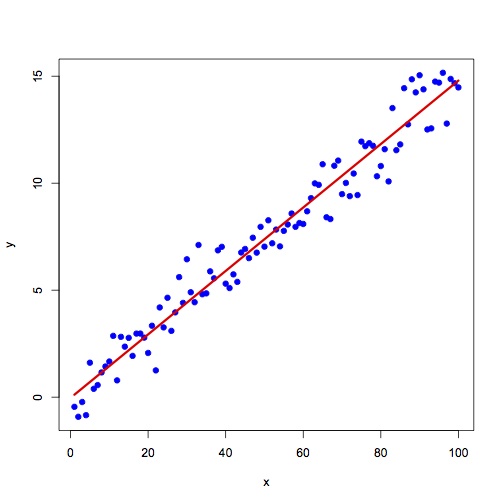
Let x be a vector starting at 1 and ending at 100. Let y be a vector equal to (x * 0.15) + N where N is a vector of random values chosen from a gaussian distribution with mean 0.0 and standard deviation 1.0.
Generate a scatterplot of (x vs y) and overlay on the plot, the line of best fit after fitting a linear model to the data: \(\hat{y} = \beta_{0} + \beta{1}x\).
add a legend: