Exercise 24
Histograms
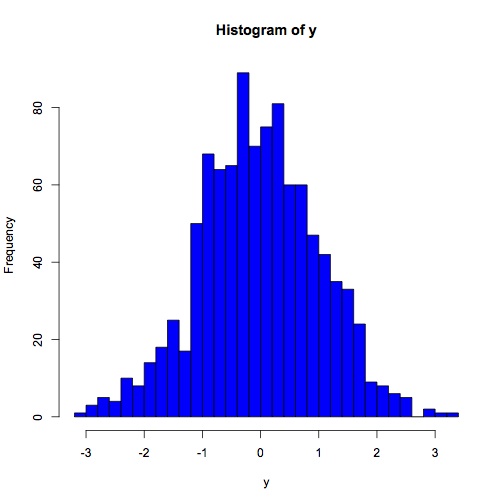
Define a variable y that contains 1000 values drawn from a gaussian distribution with mean 0.0 and standard deviation 1.0. Plot a histogram of y. For now just use the default settings for whatever function you find that produces a histogram.
Number of bins
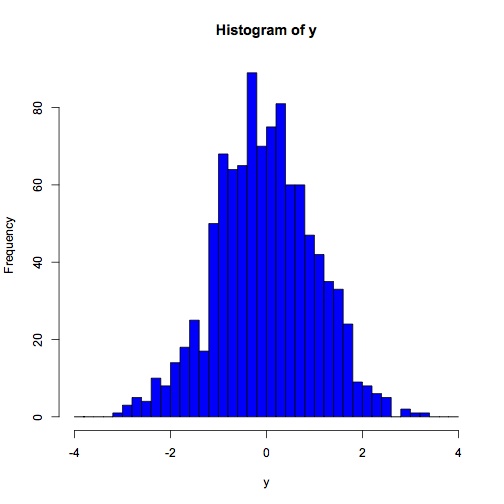
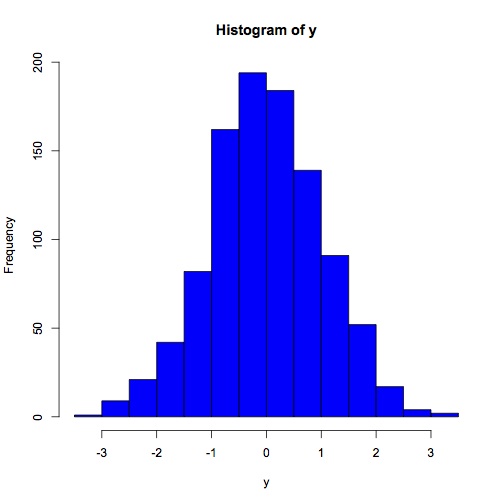
Replot the histogram using 25 bins: