Exercise 23
Subplots
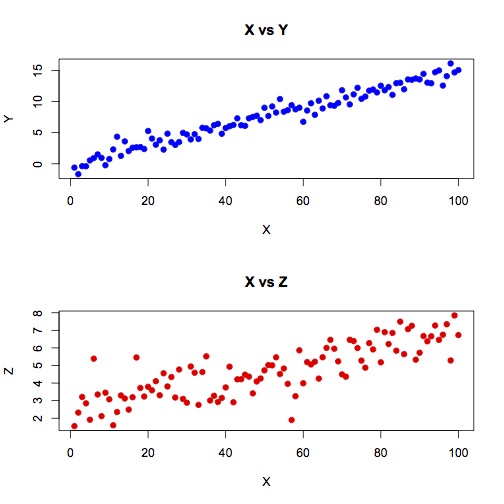
Let x be a vector starting at 1 and ending at 100. Let y be a vector equal to (x * 0.15) + N where N is a vector of random values chosen from a gaussian distribution with mean 0.0 and standard deviation 1.0.
Let z be equal to ((x * 0.05) + 2) + N where N is a vector of random values chosen from a gaussian distribution with mean 0.0 and standard deviation 1.5.
Generate a figure with scatterplots of (x vs y) and (x vs z) in separate subplots, stacked vertically:
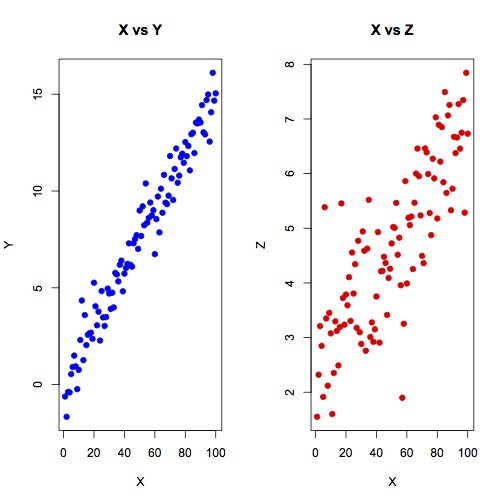
horizontally
Generate the plot again but stack the subplots horizontally:
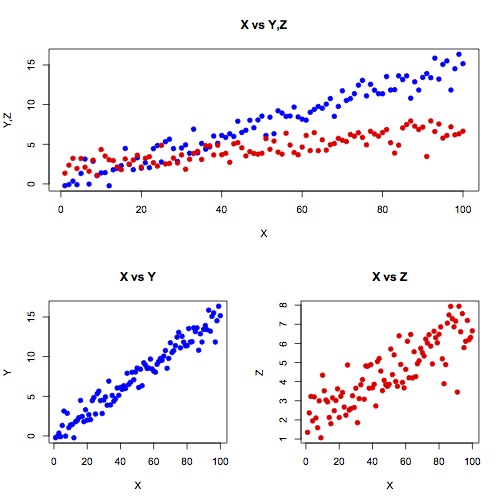
more complex arrangements
Generate the plot again with 3 subplots: one on the top, occupying the full width of the figure, in which you plot (x vs y) and (x vs z) overlayed, and two on the bottom, in which you plot (x vs y) in one and (x vs z) in the other: