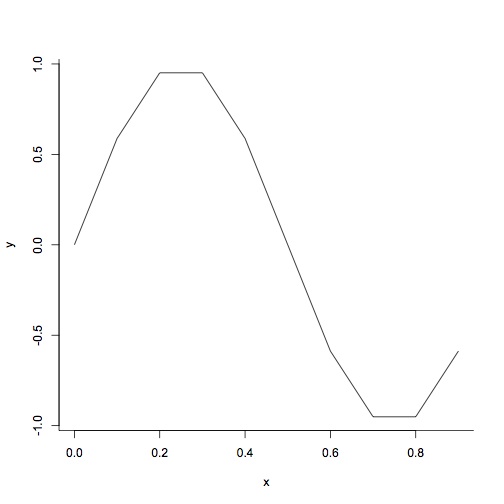
Exercise 19
Line Plot
Let x be a vector [0,0.1,0.2,0.3,0.4,0.5,0.6,0.7,0.8,0.9] and set y to be equal to sin(2*pi*x).
Generate a line plot that looks like this:
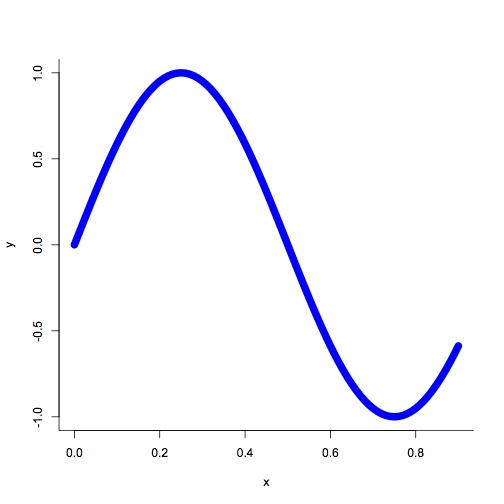
Smoother Line
Redefine x and y to make the curve smoother:
Let x be a vector [0,0.1,0.2,0.3,0.4,0.5,0.6,0.7,0.8,0.9] and set y to be equal to sin(2*pi*x).
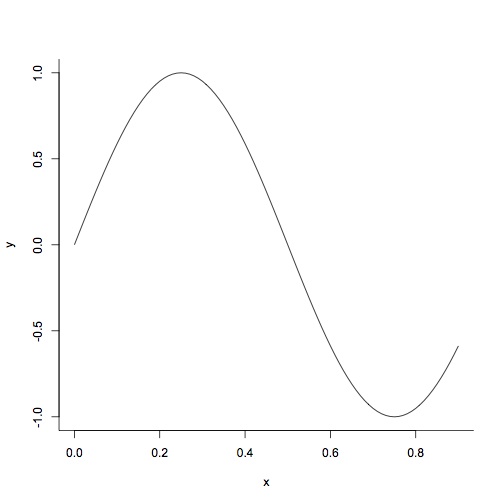
Generate a line plot that looks like this:
Redefine x and y to make the curve smoother: