import numpy as np
import pandas as pd
import scipy as sp
import matplotlib.pyplot as plt
import statsmodels.stats.weightstats as sm
import statsmodels.api as smapiHomework 7
Due: Mar 17 by 11:55 pm (London ON time)
Submit your Jupyter Notebook to OWL
Palmer Penguins
We will be using the palmerpenguins package data set. It includes size measurements for 344 adult foraging Adélie, Chinstrap, and Gentoo penguins observed on islands in the Palmer Archipelago near Palmer Station, Antarctica.
Open up a terminal and run the following command to install the package:
pip install palmerpenguinsThen, in your Jupyter Notebook, run the following code to load the data set. We will be using the pandas package to deal with the dataset. It is meant as a clone of the data.frame in R.
from palmerpenguins import load_penguins
penguins = load_penguins().dropna()
penguins.head()| species | island | bill_length_mm | bill_depth_mm | flipper_length_mm | body_mass_g | sex | year | |
|---|---|---|---|---|---|---|---|---|
| 0 | Adelie | Torgersen | 39.1 | 18.7 | 181.0 | 3750.0 | male | 2007 |
| 1 | Adelie | Torgersen | 39.5 | 17.4 | 186.0 | 3800.0 | female | 2007 |
| 2 | Adelie | Torgersen | 40.3 | 18.0 | 195.0 | 3250.0 | female | 2007 |
| 4 | Adelie | Torgersen | 36.7 | 19.3 | 193.0 | 3450.0 | female | 2007 |
| 5 | Adelie | Torgersen | 39.3 | 20.6 | 190.0 | 3650.0 | male | 2007 |
T-test
You are interested in testing whether Adelie and Gentoo penguins have different average weights.
Conduct an independent samples t-test comparing the weights of Adelie and Gentoo penguins. Report means and standard errors of the means for each group.
Generate some kind of plot to visualize the data. You can use seaborn or matplotlib or whatever you want.
Report the results of the t-test: report the t-statistic, the degrees of freedom, and the p-value.
Use a significance level of 0.05 to make your decision. What is your conclusion?
Adelie mean = 3706.16 (sem = 37.96)
Gentoo mean = 5092.44 (sem = 45.97)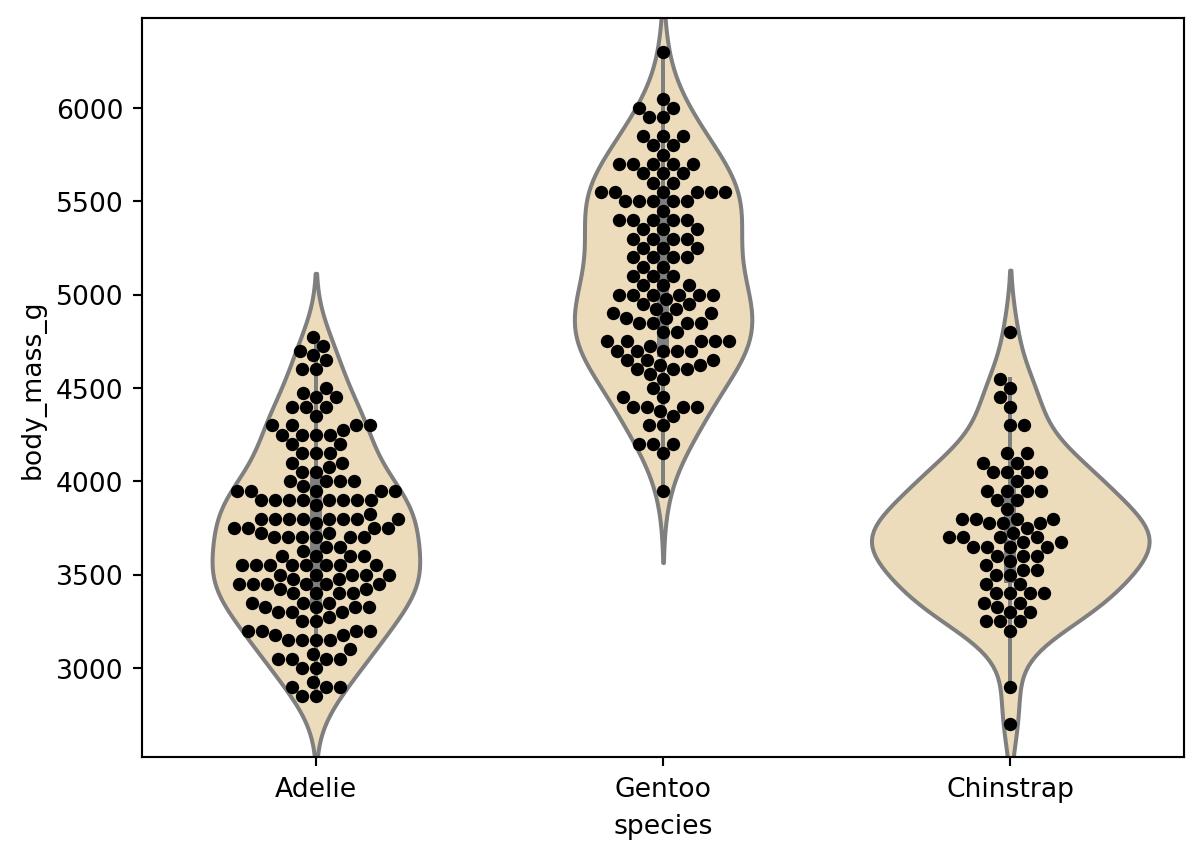
t(263.0) = -23.467, p = 1.8806652580953223e-66Correlation
You are interested in testing the hypothesis that penguin’s weight is correlated with their flipper length. Focus on Chinstrap penguins only.
First plot the data. Plot flipper length on the x-axis and weight on the y-axis. Use a scatter plot.
Conduct a Pearson correlation test. Report the correlation coefficient, the t-statistic, the degrees of freedom, and the p-value. What is your conclusion?
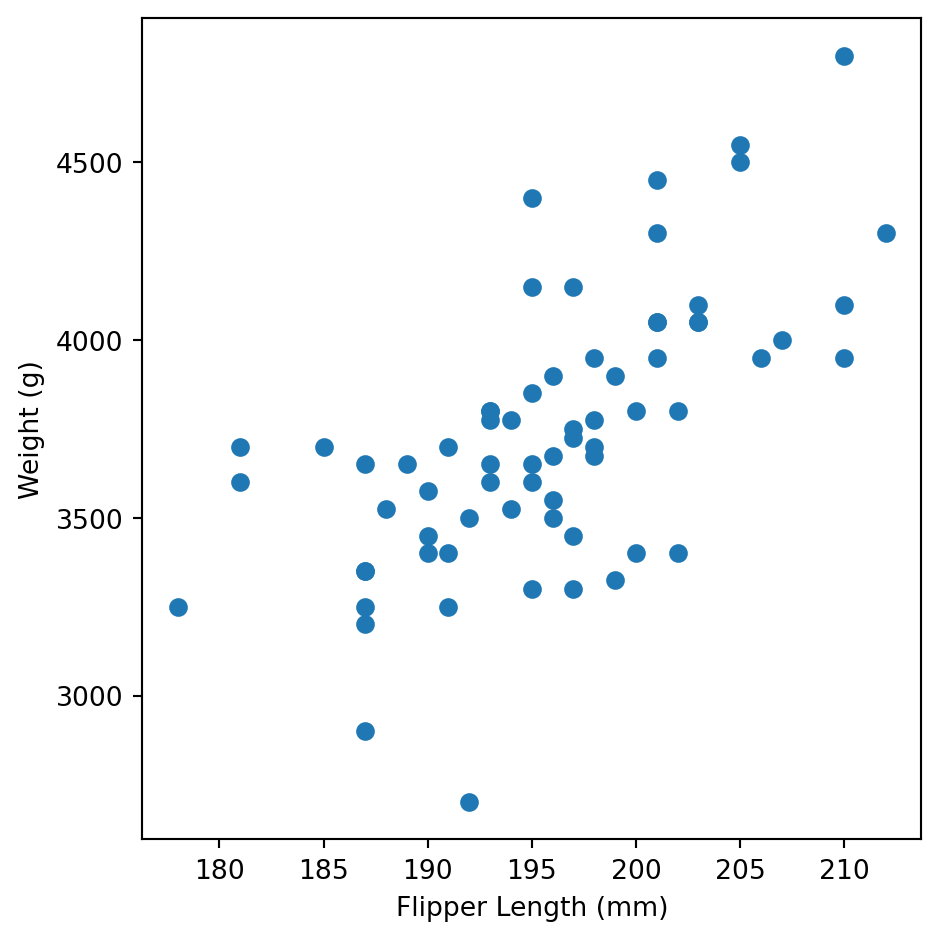
r = 0.642, p = 3.748129999231768e-09
95% CI on r: ConfidenceInterval(low=0.47593520947840534, high=0.763236848347039)
Linear Regression
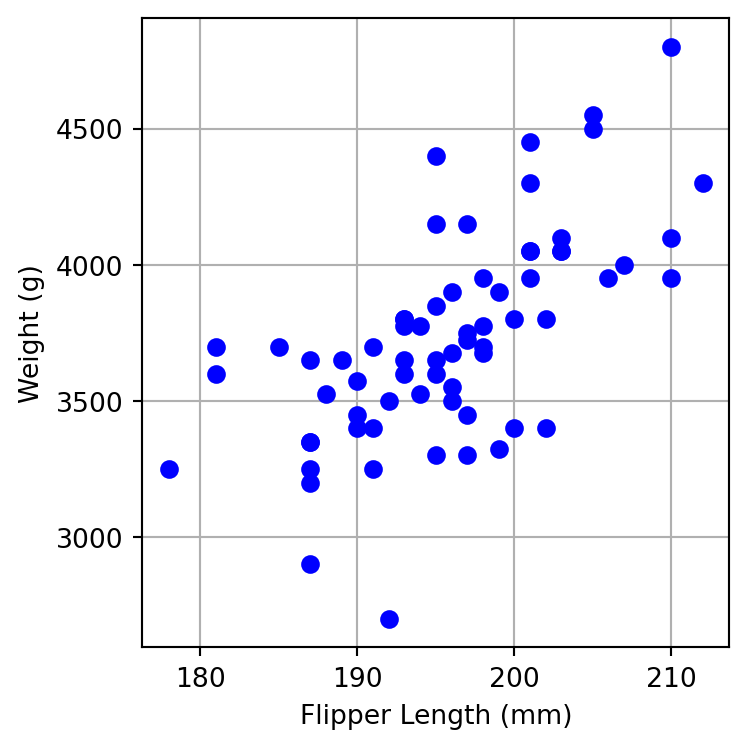
You would like to mount another expedition to Antarctica to measure more penguins. However measuring a penguin’s weight is really difficult, they are not cooperative. Measuring their flipper length is much easier. You would like to develop a linear model to predict a penguin’s weight from their flipper length. Focus on Chinstrap penguins only.
\[\hat{Y} = \beta_0 + \beta_1 X_1 + \varepsilon\]
where \(\hat{Y}\) is the predicted weight, \(\beta_0\) is the intercept, and \(\beta_1\) is the slope of the relationship between weight and flipper length.
First make a scatter plot of flipper length on the x-axis and weight on the y-axis.
Next, fit the model and report values of the intercept and \(\beta_1\).
                            OLS Regression Results
==============================================================================
Dep. Variable:            body_mass_g   R-squared:                       0.412
Model:                            OLS   Adj. R-squared:                  0.403
Method:                 Least Squares   F-statistic:                     46.17
Date:                Wed, 06 Sep 2023   Prob (F-statistic):           3.75e-09
Time:                        09:19:54   Log-Likelihood:                -482.66
No. Observations:                  68   AIC:                             969.3
Df Residuals:                      66   BIC:                             973.7
Df Model:                           1
Covariance Type:            nonrobust
=====================================================================================
                        coef    std err          t      P>|t|      [0.025      0.975]
-------------------------------------------------------------------------------------
const             -3037.1958    997.054     -3.046      0.003   -5027.878   -1046.514
flipper_length_mm    34.5734      5.088      6.795      0.000      24.414      44.732
==============================================================================
Omnibus:                        1.839   Durbin-Watson:                   2.573
Prob(Omnibus):                  0.399   Jarque-Bera (JB):                1.142
Skew:                          -0.152   Prob(JB):                        0.565
Kurtosis:                       3.557   Cond. No.                     5.42e+03
==============================================================================

Notes:
[1] Standard Errors assume that the covariance matrix of the errors is correctly specified.
[2] The condition number is large, 5.42e+03. This might indicate that there are
strong multicollinearity or other numerical problems.
Compute the standard error of the estimate (SEE) for your regression model. This is a measure of the typical error in estimating weight from flipper length. Remember from your stats classes, the equation is:
\[SEE = \sqrt{\frac{1}{n-2} \sum_{i=1}^n (\mathrm{resid}_{i})^2}\]
where \(n\) is the number of observations, and \(\mathrm{resid}_{i}\) is the ith residual. The residual is the difference between the observed value of \(Y\) and the predicted value of \(Y\). Residuals can be obtained from an OLS model using model.resid.
SEE = 297.038 gRe-do the plot from above and include the regression line.
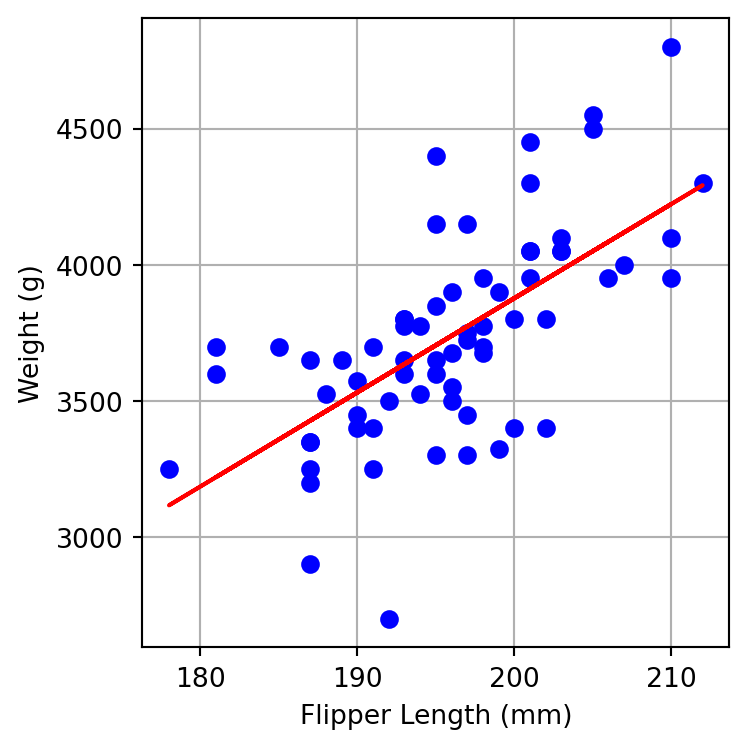
Report the values and comment on the interpretation of:
- intercept
- slope
- p-value of the slope
- R-squared
- SEE