[[3.14159265 3.14159265 3.14159265 3.14159265 3.14159265]
 [3.14159265 0.         0.         0.         3.14159265]
 [3.14159265 0.         0.         0.         3.14159265]
 [3.14159265 0.         0.         0.         3.14159265]
[3.14159265 3.14159265 3.14159265 3.14159265 3.14159265]]Homework 4
Due: Feb 17 by 11:55 pm (London ON time)
Submit your Jupyter Notebook to OWL
Note that you don’t need to complete each question using a single Python command. You may use multiple lines of code. Also note that there is not one single correct way of completing each question. There are many ways you might code up the solution to each.
NumPy Exercises
Create a
5x52D array with \(\pi\) on the border and0inside and print it to the screen.Consider the
1x101D arrayZ:Z = np.array([3,1,4,1,5,9,2,6,5,3]) print(Z)[3 1 4 1 5 9 2 6 5 3]Compute the sum of squared elements of
Zand print it to the screen:207Set NumPy’s random number generator seed to
9040. Then create a10x52D array containing random integers between 10 and 20, inclusive and print it to the screen:np.random.seed(9040)[[10 11 12 16 14] [14 18 18 18 13] [16 18 16 17 15] [13 20 15 16 10] [16 17 13 17 12] [11 12 10 13 14] [17 18 16 15 13] [13 16 13 10 18] [13 12 17 19 12] [20 11 17 13 10]]Consider a
1x101D array of integersZ:np.random.seed(9040) Z = np.random.randint(0,1000,10)Print out the unique elements of
Z, sorted in descending order (largest first, smallest last):[942 898 884 838 728 703 689 516 509 416]Construct a
1x50arrayZcontaining the sequence5,4,3,2,1repeated 10 times:[5 4 3 2 1 5 4 3 2 1 5 4 3 2 1 5 4 3 2 1 5 4 3 2 1 5 4 3 2 1 5 4 3 2 1 5 4 3 2 1 5 4 3 2 1 5 4 3 2 1]
Matplotlib exercises
Define a 1D array
xcontaining 10 values starting at 0, ending at 0.9, in increments of 0.1. Define a vectorythat is equal tonp.sin(2 * np.pi * x). Generate a line plot withxon the horizontal axis andyon the vertical axis. Use blue circles at each data point (markersize of 8.0), connected by blue solid lines, with a linewidth of 2.0. Label the horizontal axisxand the vertical axisy. Set the range on the horizontal axis so it goes from 0 to 0.9 in steps of 0.1, and on the vertical axis so it goes from -1 to 1 in steps of 0.2.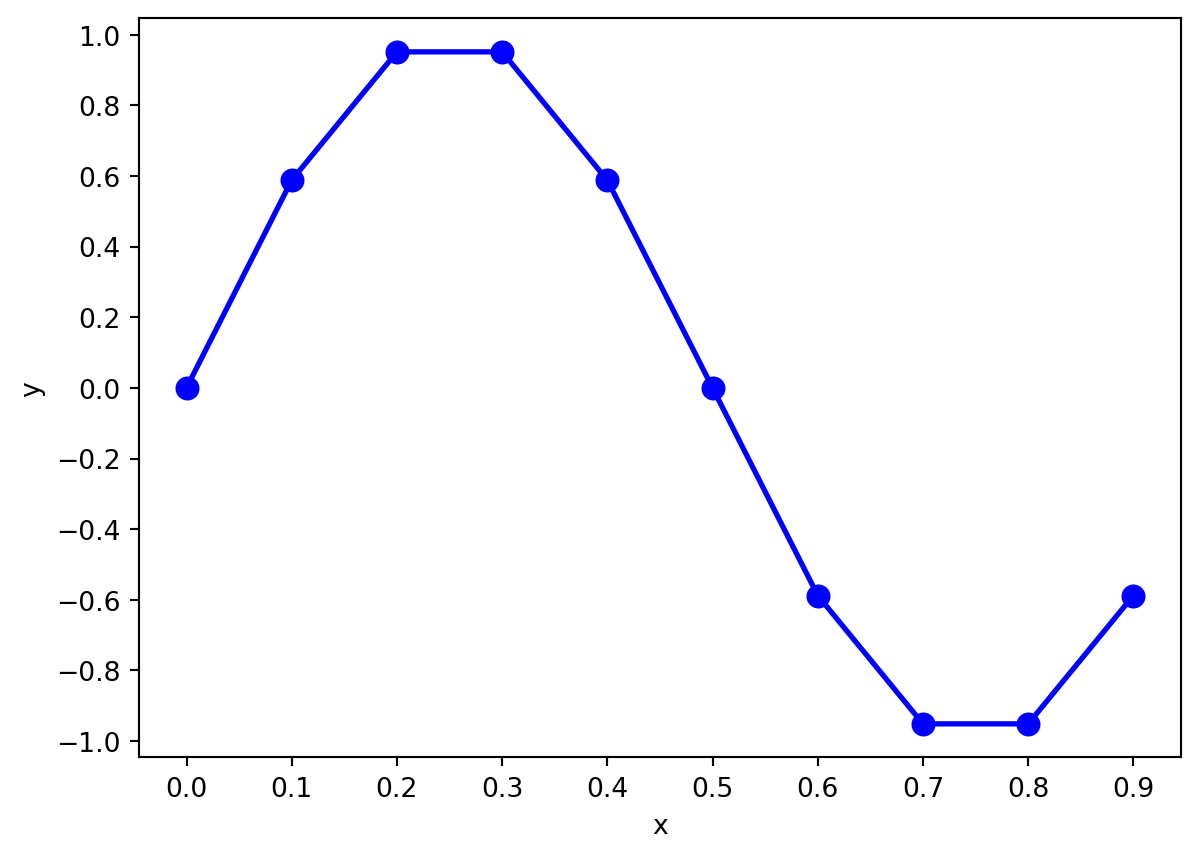
Define 1D arrays
y1equal to[1,2,3,4,4],y2equal to[1,5,6,8,10], andy3equal to[5,4,2,1,1]. Generate a multi-line plot using squares (markersize 6.0) connected with solid lines (linewidth 1.0). Label the axes as shown, and set axis limits and axis ticks as shown. Add a legend as shown. They1colour is blue, they2colour is red, and they3colour is magenta.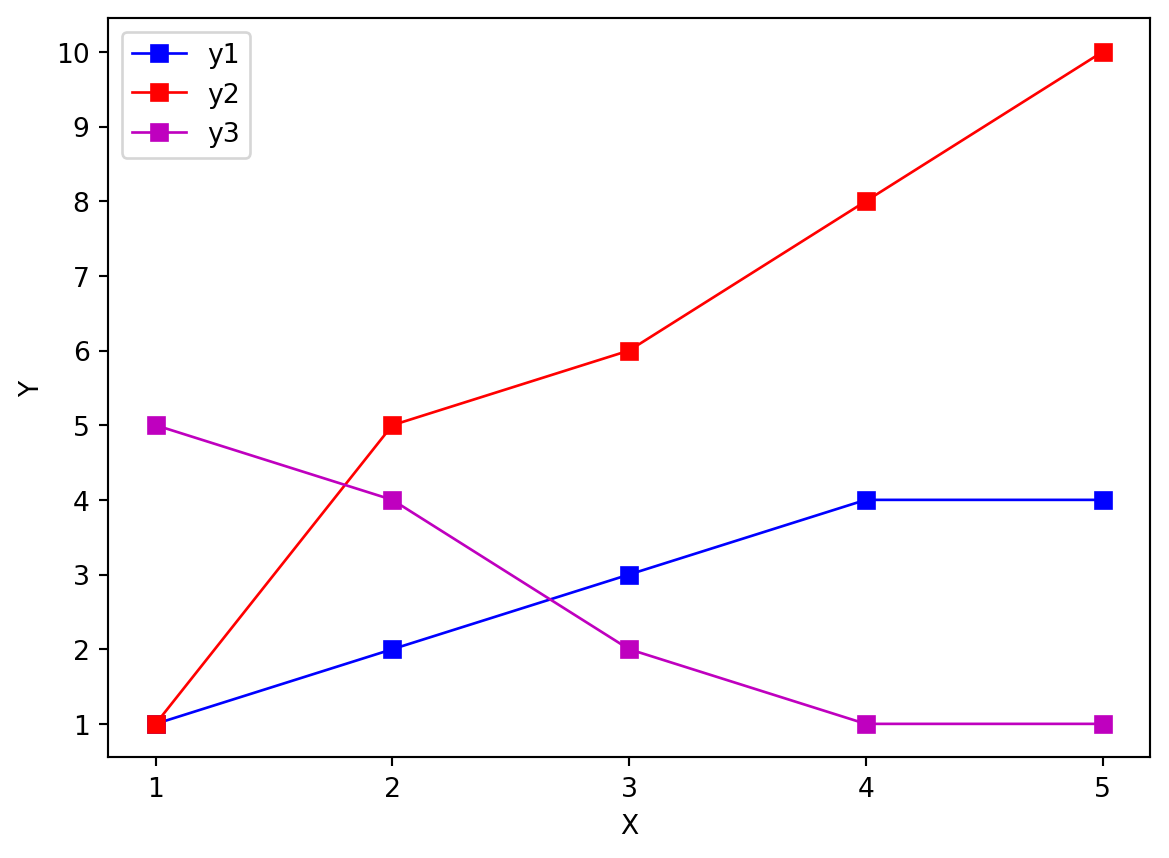
Define a 100-length 1D array
xstarting at 1 and ending at 100 in increments of 1. Defineyequal to(x * 0.15) + Nwhere N is a 100 element 1D array of random values chosen from a gaussian distribution with mean 0.0 and standard deviation 0.5. Letzbe equal to((x * 0.05) + 2) + N2whereN2is a 100 element 1D array of random values chosen from a gaussian distribution with mean 0.0 and standard deviation 2.0. Generate a scatterplot as shown below, using filled circles (markersize 3.0). Theycolour is blue and thezcolour is red. Pay attention to the axis labels, tick marks, and ranges. At the beginning of your answer set the random seed (once) to be equal to9040so that we all get the same random values, usingnp.random.seed(9040).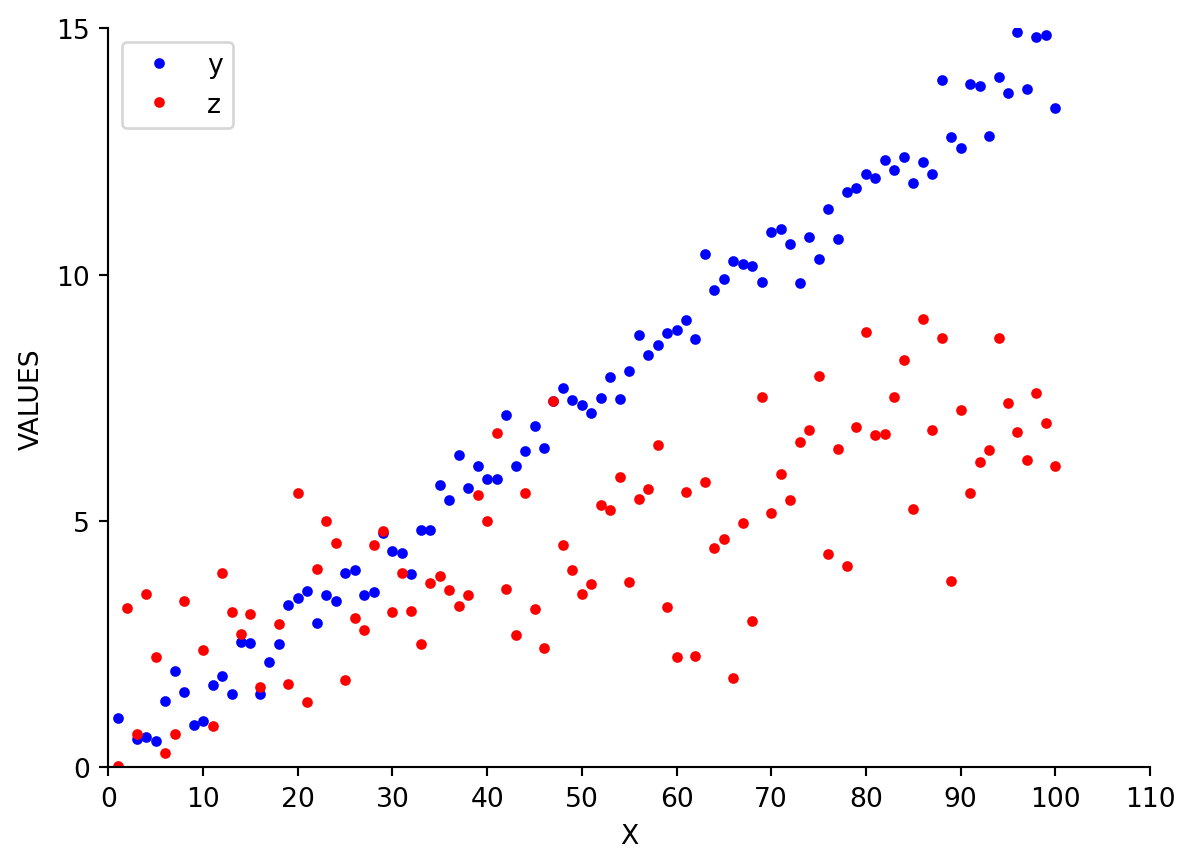
Re-plot the data from Question 8 using subplots, as shown below. Try to replicate the axis limits, and axis labeling. Use boldface font to add a title to each subplot (A, B, and C, aligned to the left of each subplot as shown below).
Hint: adjust the
hspaceparameter for subplots so that the subplots don’t overlap, e.g.plt.subplots_adjust(hspace=0.6).
Hint:ax.spines["top"].set_visible(False)will turn off the top part of the box outlining each plot.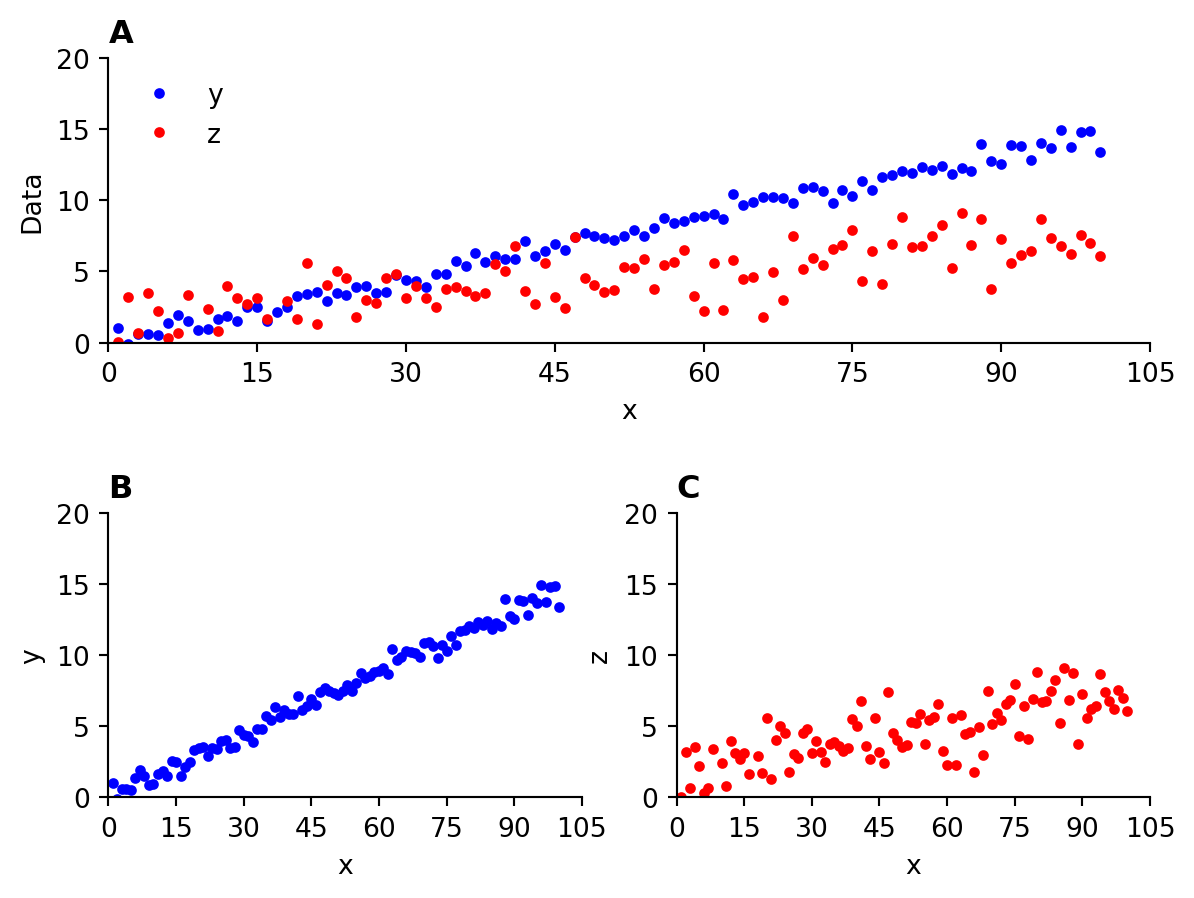
Do your best to replicate all of the elements of the Figure. If you can’t replicate every little part of it don’t worry, but challenge yourself to try to get as close as you can. I will post a sample solution after the deadline.