Repeated Measures ANOVA

Week 11

Final Exam

  • sample questions are posted on the course website
  • review the lecture slides
  • review the readings
  • review the homeworks
  • focus on concepts first not the tiniest details

Repeated Measures Experiments

  • sometimes also called “within-subjects” or “within-participants”
  • the same participant is measured on the same dependent variable multiple times (more than 2)
  • (if only 2 measurements just use a paired samples t-test)

Repeated Measures Experiments

  • e.g. the same participant is measured on their mood (1) before and (2) after a treatment and then (3) again after a week
  • effects of placebo vs treatment A vs treatment B on blood pressure can be studied in the same participants, each participant can serve as their own control
  • behaviour of subjects can be studied over multiple time points

Advantages of Repeated Measures Designs

  • sometimes participants can serve as their own control
    • (no need for a separate control group)
  • variance between levels of a factor is reduced
    • no longer due to effect + inter-subject variability
    • it’s the same subjects!
  • variance across levels of the factor is only due to the effect of the factor

Advantages of Repeated Measures Designs

  • more information is obtained from each participant than in a between-subjects design
  • within-subjects design: each subject contributes a scores
    • (a = number of levels of the repeated-measures factor)
  • between-subjects design: each subject contributes only 1 score
  • the number of subjects required to reach a given level of statistical power is often much lower in a within-subjects design than in a between-subjects design

Advantages of Repeated Measures Designs

  • same subject measured in each level of the factor
  • variability in individual differences between subjects is removed from the ANOVA error term
  • ANOVA error term (denominator of the F ratio) is reduced
  • statistical power to detect an effect of the factor is increased

Example dataset

Code
library(tidyverse)
rmdata <- read_csv(url("https://www.gribblelab.org/2812/data/rmdata.csv"),
                   col_types="fnnn")
rmdata
# A tibble: 10 × 5
   Subject    A1    A2    A3    A4
   <fct>   <dbl> <dbl> <dbl> <dbl>
 1 1           8    10     7     5
 2 2           9     9     8     6
 3 3           7     5     8     4
 4 4           9     6     5     7
 5 5           8     7     7     6
 6 6           5     4     4     3
 7 7           7     6     5     4
 8 8           8     8     6     6
 9 9           9     8     6     5
10 10          7     7     4     5
  • as an exercise let’s treat this dataset as a between-subjects design
Code
# convert from wide to long format
rmdata_long <- gather(rmdata, FactorA, DV, A1:A4, factor_key=TRUE)
# compute a between-subjects ANOVA
aov.bet <- aov(DV ~ FactorA, data=rmdata_long)
summary(aov.bet)
            Df Sum Sq Mean Sq F value  Pr(>F)   
FactorA      3   38.9  12.967   6.062 0.00189 **
Residuals   36   77.0   2.139                   
---
Signif. codes:  0 '***' 0.001 '**' 0.01 '*' 0.05 '.' 0.1 ' ' 1
  • what we’re missing out on is the fact that some of the total variance in the data is due to differences between the subjects
  • what if we were to include a second factor called Subject that coded for the subject number?
Code
aov.bet2 <- aov(DV ~ FactorA + Subject, data=rmdata_long)
summary(aov.bet2)
            Df Sum Sq Mean Sq F value   Pr(>F)    
FactorA      3   38.9  12.967  12.241 3.06e-05 ***
Subject      9   48.4   5.378   5.077 0.000471 ***
Residuals   27   28.6   1.059                     
---
Signif. codes:  0 '***' 0.001 '**' 0.01 '*' 0.05 '.' 0.1 ' ' 1
  • notice how the Sum Sq for Residuals is much smaller now
  • Mean Sq for Residuals (the “error term” for the ANOVA) is also much smaller
  • So our F value is much larger for Factor A

including Subjects reduces the ANOVA error term

  • 48.4 + 28.6 = 77.0

including Subjects reduces the ANOVA error term

  • 77.0 / 36 = 2.139
  • 28.6 / 27 = 1.059

including Subjects increases F

  • 12.967 / 2.139 = 6.062

  • 12.967 / 1.059 = 12.241

  • a more statistically powerful test of the effect of Factor A

  • more likely to detect a true difference

Repeated Measures ANOVA

our little experiment including Subjects as a factor:

            Df Sum Sq Mean Sq F value   Pr(>F)    
FactorA      3   38.9  12.967  12.241 3.06e-05 ***
Subject      9   48.4   5.378   5.077 0.000471 ***
Residuals   27   28.6   1.059                     
---
Signif. codes:  0 '***' 0.001 '**' 0.01 '*' 0.05 '.' 0.1 ' ' 1
  • this is in fact what repeated measures ANOVA does, essentially
  • it accounts for the differences in the DV across subjects,
  • and removes that variability from the error term

Repeated Measures ANOVA in R

  • the right way to do it (which becomes more important with multiple factors and more complex designs):
aov.rm <- aov(DV ~ FactorA + Error(Subject/FactorA), data=rmdata_long)
summary(aov.rm)

Error: Subject
          Df Sum Sq Mean Sq F value Pr(>F)
Residuals  9   48.4   5.378               

Error: Subject:FactorA
          Df Sum Sq Mean Sq F value   Pr(>F)    
FactorA    3   38.9  12.967   12.24 3.06e-05 ***
Residuals 27   28.6   1.059                     
---
Signif. codes:  0 '***' 0.001 '**' 0.01 '*' 0.05 '.' 0.1 ' ' 1

Repeated Measures ANOVA in R

aov.rm <- aov(DV ~ FactorA + Error(Subject/FactorA), data=rmdata_long)
summary(aov.rm)

Error: Subject
          Df Sum Sq Mean Sq F value Pr(>F)
Residuals  9   48.4   5.378               

Error: Subject:FactorA
          Df Sum Sq Mean Sq F value   Pr(>F)    
FactorA    3   38.9  12.967   12.24 3.06e-05 ***
Residuals 27   28.6   1.059                     
---
Signif. codes:  0 '***' 0.001 '**' 0.01 '*' 0.05 '.' 0.1 ' ' 1
  • Error(Subject/FactorA) is the way to tell the aov() function that FactorA is a within-subjects factor

Linear Models for Repeated Measures ANOVA

H_{1}: Y_{ij} = \mu + \alpha_{j} + \pi_{i} + \varepsilon_{ij}
H_{0}: Y_{ij} = \mu + \pi_{i} + \varepsilon_{ij}

  • Y_{ij} is the value of the DV for the ith subject at the jth level of the repeated measures factor
  • \mu is the grand mean of the entire dataset across all subjects and all levels of the repeated measures factor
  • \alpha_{j} is the effect of the jth level of the repeated measures factor
  • \pi_{i} is the effect of the ith subject
  • \varepsilon_{ij} is the unexplained varability in the ith subject at the jth level of the repeated measures factor

Linear Models for Repeated Measures ANOVA

H_{1}: Y_{ij} = \mu + \alpha_{j} + \pi_{i} + \varepsilon_{ij}
H_{0}: Y_{ij} = \mu + \pi_{i} + \varepsilon_{ij}

  • full model (H_{1}) includes the effect of the factor (\alpha_{j}) AND the effect of subjects (\pi_{i})
  • restricted model (H_{0}) only includes effect of subjects (effect of factor is zero)
  • null hypothesis H_{0} is that the factor \alpha_{j} has no effect on the DV; the only things that affect the DV are inter-subject differences \pi_{i} and random variability \varepsilon_{ij}

Assumptions of Repeated Measures ANOVA

  • random sampling from the population
  • independence of subjects
  • normality ^{*}
  • no extreme outliers ^{*}
  • homogeneity of treatment-difference variances ^{*}
    • also called “sphericity”
    • the variances of the differences between all pairwise combinations of groups are equal

Normality

  • some say it’s better to perform tests on each level of the RM factor
library(rstatix) # for shapiro_test()
rmdata_long %>%
    group_by(FactorA) %>%
    shapiro_test(DV)
# A tibble: 4 × 4
  FactorA variable statistic     p
  <fct>   <chr>        <dbl> <dbl>
1 A1      DV           0.871 0.102
2 A2      DV           0.984 0.982
3 A3      DV           0.918 0.341
4 A4      DV           0.952 0.691
library(ggpubr) # for ggqqplot()
ggqqplot(rmdata_long, "DV", facet.by="FactorA")

Extreme Outliers

  • we can use the identify_outliers() function from the rstatix package
library(rstatix) # for identify_outliers()
rmdata_long %>%
    group_by(FactorA) %>%
    identify_outliers(DV)
[1] FactorA    Subject    DV         is.outlier is.extreme
<0 rows> (or 0-length row.names)
  • 0 rows = empty list so no outliers

Sphericity

  • homogeneity of treatment-difference variances
  • the variances of the differences between all pairwise combinations of groups are equal
  • Mauchly’s Test is the most common test for sphericity

Sphericity

  • if we use the ezANOVA() function from the ez package to perform our repeated measures ANOVA instead of the aov() function, we will automatically get:
    • results of Mauchly’s test of sphericity
    • Greenhouse-Geisser corrected F value and p value

Greenhouse-Geisser Correction

  • estimates epsilon (a metric of sphericity)
  • if sphericity is violated, epsilon is < 1.0
  • denominator df for the F-ratio is corrected (lowered) by multiplying with epsilon
  • F-ratio is recomputed using corrected df
  • some prefer the “Huynh–Feldt correction” which is slightly less conservative when sphericity is violated only slightly
  • ezANOVA() function shows both GG and HF corrected F and p values

Repeated Measures ANOVA in R using ezANOVA()

Code
library(ez)
rm.anova <- ezANOVA(data=rmdata_long, dv=DV, wid=Subject, within=FactorA)
rm.anova
$ANOVA
   Effect DFn DFd        F            p p<.05       ges
2 FactorA   3  27 12.24126 3.059801e-05     * 0.3356342

$`Mauchly's Test for Sphericity`
   Effect         W         p p<.05
2 FactorA 0.3461323 0.1488387      

$`Sphericity Corrections`
   Effect       GGe        p[GG] p[GG]<.05       HFe        p[HF] p[HF]<.05
2 FactorA 0.7426009 0.0002387789         * 0.9981017 3.106252e-05         *
  • ezANOVA() is a wrapper around aov() that makes it easier to do repeated measures (and mixed repeated-between) ANOVA
  • it computes Mauchly’s test of sphericity
  • and shows both GG and HF corrected F and p values

Repeated Measures ANOVA in R using ezANOVA()

Code
library(ez)
rm.anova <- ezANOVA(data=rmdata_long, dv=DV, wid=Subject, within=FactorA)
rm.anova
$ANOVA
   Effect DFn DFd        F            p p<.05       ges
2 FactorA   3  27 12.24126 3.059801e-05     * 0.3356342

$`Mauchly's Test for Sphericity`
   Effect         W         p p<.05
2 FactorA 0.3461323 0.1488387      

$`Sphericity Corrections`
   Effect       GGe        p[GG] p[GG]<.05       HFe        p[HF] p[HF]<.05
2 FactorA 0.7426009 0.0002387789         * 0.9981017 3.106252e-05         *
  • Some say one should always use the (GG or HF) corrected F and p values, because sphericity is never perfect (never exactly 1.0)
  • the corrections are graded—the less/more sphericity is violated, the more the correction
  • so the corrected F and p values are always more ‘correct’ than the uncorrected ones

Post-hoc tests

  • just like before with between-subjects ANOVA we can use emmeans() and pairs()
library(emmeans) # for emmeans() and pairs()
rm.anova <- aov(DV ~ FactorA + Error(Subject/FactorA), data=rmdata_long)
mm <- emmeans(rm.anova, specs = ~ FactorA)
pairs(mm, adjust = "holm")
 contrast estimate   SE df t.ratio p.value
 A1 - A2       0.7 0.46 27   1.521  0.1399
 A1 - A3       1.7 0.46 27   3.693  0.0040
 A1 - A4       2.6 0.46 27   5.649  <.0001
 A2 - A3       1.0 0.46 27   2.173  0.1163
 A2 - A4       1.9 0.46 27   4.128  0.0016
 A3 - A4       0.9 0.46 27   1.955  0.1219

P value adjustment: holm method for 6 tests 

Disadvantages of Repeated Measures ANOVA

  • order effects
  • e.g. a neuroscientist wants to compare the effects of placebo vs drug A vs drug B on aggressiveness in monkeys
  • every pair of monkeys will be observed three times, once for each condition
  • how should we design the study?
  • one possibility: placebo day 1 then drug A day 2 then drug B day 3
  • bad idea: confounds potential drug effects with effect of time
  • maybe monkeys become less aggressive over time

Counterbalancing

  • one solution is to counterbalance the order of the conditions
  • some get [placebo day 1] -> [drug A day 2] -> [drug B day 3]
  • others get [placebo day 1] -> [drug B day 2] -> [drug A day 3]
  • we can do statistical tests to see if the order of the conditions matters
    • e.g. by coding the order of the conditions as a between-subjects factor in the ANOVA

Latin Square Designs

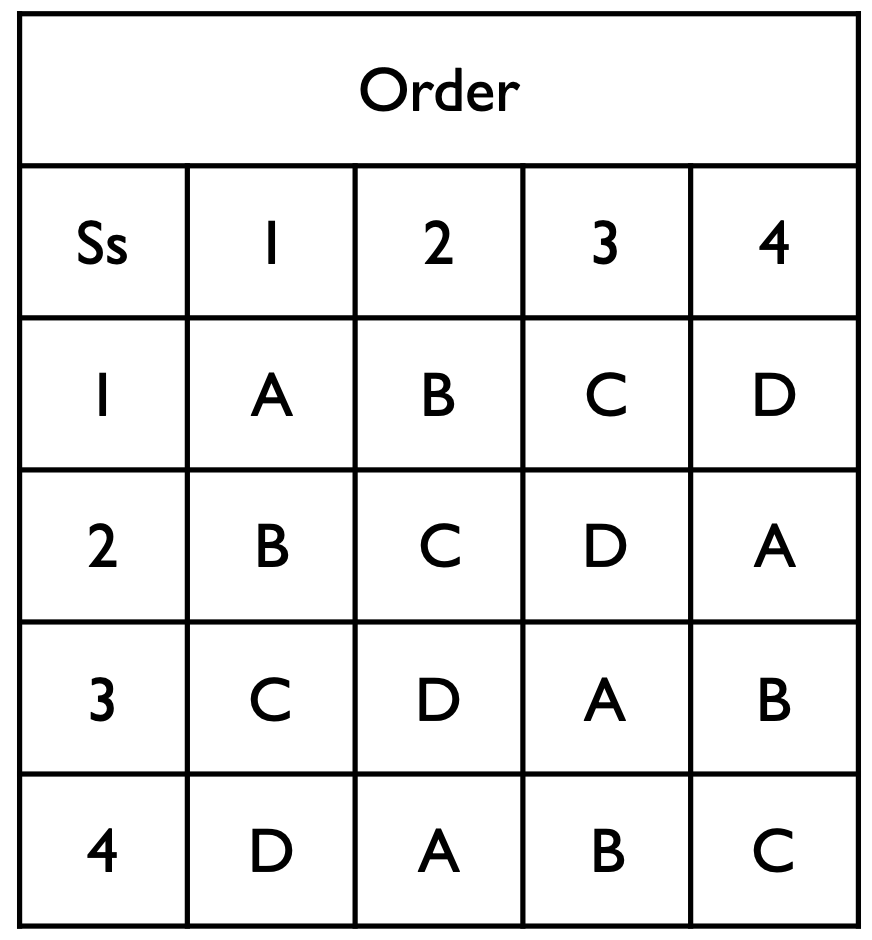
  • but what if we have multiple levels of the within-subjects factor, e.g. A,B,C,D
  • many possible counterbalancing schemes (24 of them for 4 levels!)
  • not feasible to repeat our experiment with all of them
  • a Latin Square design is a way to counterbalance the order of the conditions in a principled way
  • every condition is presented exactly once in each row and column

Latin Square Designs

Differential Carryover Effects

  • a nasty problem with repeated measures designs
  • placebo -> drug A -> drug B
  • what if the drug A has a carryover effect that influences the DV in the drug B condition?
  • and
  • what if that is different than the carryover effect of drug B onto the DV in the drug A condition?
  • counterbalancing or Latin Squares will not help us here

Differential Carryover Effects

  • we could introduce a long “washout” period after one drug to let enough time elapse to eliminate the carryover effect
  • can’t always be done, some carryover effects are permanent
    • (e.g. lesions, or some drugs, or learning & memory experiments)
  • some scientific questions are better suited to between-subjects designs

Other ANOVA designs

  • Mixed ANOVA: combination of between- and within-subjects factors
  • sometimes called “Split-Plot ANOVA”
  • e.g. factor A is “time” and has three levels, (day 1, day 2, day 3)
  • factor B is “drug” and has two levels (placebo, drug A)
  • DV is “aggressiveness” of a monkey
  • each monkey is randomly assigned to either placebo or drug A
  • each monkey is observed three times, once for each level of time
  • this is a mixed ANOVA design
    • “time” is a within-subjects factor
    • “drug” is a between-subjects factor

Other ANOVA designs

  • MANOVA: Multivariate Analysis of Variance
  • ANOVA with multiple DVs
  • allows us to test for effects of one or more factors across multiple DVs at the same time, in a principled way that takes into account the multiple comparisons problem
  • also accounts for correlation between the different DVs

Linear Mixed Effects Models

  • a generalization of ANOVA that allows us to model more complex designs
  • handles unbalanced designs and missing data much better than traditional ANOVA
  • can be used to model repeated measures designs
  • nested designs (e.g. children within classrooms within schools within school districts)

Go Forth And Do Science!

  • we have focused on concepts and main principles
  • we have not covered every tiny detail
  • all the complex approaches/models you will learn about next are just extensions of the basic concepts we have covered here
  • remember often there are different approaches
  • try to understand the tradeoffs, and choose for yourself
  • Data is currency in science
  • Good data comes from good experimental designs
  • Have fun!

Office Hours

  • I will set up one or two office hours between now and the final exam
  • you can come and ask Qs about the course material
  • I will send an announcement via OWL about day/time(s)