Multiple Regression
Week 4
Multiple Regression
- In bivariate regresssion we use X to predict Y:
- Y_{i} = \beta_{0} + \beta_{1} X + \varepsilon_{i}
- one dependent variable Y
(the variable to be predicted) - one independent variable X
(the variable we are using to predict Y) - N different observations of
(X_{i},Y_{i}), for i=1 \dots N - two model coefficients:
- \beta_{0} (intercept)
- \beta_{1} (slope)
Multiple Regression
- In Multiple Regression: we use N predictor variables X_{1}, X_{2}, \dots X_{N} to predict Y
- Y_{i} = \beta_{0} + \beta_{1} X_{i1} + \beta_{2} X_{i2} + \dots + \beta_{k} X_{ik} +\varepsilon_{i}
- one dependent variable Y (the variable to be predicted)
- K independent variables X_{k}, for k=1 \dots K
- N different observations (X_{ik},Y_{i}), for i=1 \dots N
- k+1 model coefficients \beta (one slope for each X_{i} plus a model intercept \beta_{0}) Y_{i} = \beta_{0} + \displaystyle\sum_{k=1}^{K} \left( \beta_{k} X_{ik} \right) +\varepsilon_{i} (for i=1 \dots N observations)
1 predictor
- Y_{i} = \beta_{0} + \beta_{1} X + \varepsilon_{i}
- one dependent variable Y
(the variable to be predicted) - one independent variable X
(the variable we are using to predict Y) - N different observations of
(X_{i},Y_{i}), for i=1 \dots N - two model coefficients:
- \beta_{0} (intercept)
- \beta_{1} (slope)

2 predictors
- Y_{i} = \beta_{0} + \beta_{1} X_{i1} + \beta_{2} X_{i2} +\varepsilon_{i}
- Model a car’s fuel efficiency (MPG) as a function of:
- the weight of the car
- the car’s engine size
- Y: MPG of cars
- X_{1}: car weight
- X_{2}: engine size
- \beta_{1}: dependence of (slope of) MPG (Y) on car weight (X_{1})
- \beta_{2}: dependence of (slope of) MPG (Y) on engine size (X_{2})
- \beta_{0}: intercept — predicted MPG (Y) when car weight and engine size are both zero
2 predictors
- Y_{i} = \beta_{0} + \beta_{1} X_{i1} + \beta_{2} X_{i2} +\varepsilon_{i}
MPG ~ Weight + Displacement(using themtcarsbuilt-in dataset)

2 predictors
- Y_{i} = \beta_{0} + \beta_{1} X_{i1} + \beta_{2} X_{i2} +\varepsilon_{i}
MPG ~ Weight + Displacement

2 predictors
- Y_{i} = \beta_{0} + \beta_{1} X_{i1} + \beta_{2} X_{i2} +\varepsilon_{i}
MPG ~ Weight + Displacement- value of \beta_{1}: MPG dependency (slope) on Weight

2 predictors
- Y_{i} = \beta_{0} + \beta_{1} X_{i1} + \beta_{2} X_{i2} +\varepsilon_{i}
MPG ~ Weight + Displacement- value of \beta_{2}: MPG dependency (slope) on Displacement

K predictors
Y_{i} = \beta_{0} + \displaystyle\sum_{k=1}^{K} \left( \beta_{k} X_{ik} \right) +\varepsilon_{i} - sorry! I can’t draw in > 3 dimensions


Multiple Regression
- Multiple Regression: we use N predictor variables X_{1}, X_{2}, \dots X_{N} to predict Y
- Y_{i} = \beta_{0} + \beta_{1} X_{i1} + \beta_{2} X_{i2} + \dots + \beta_{k} X_{ik} +\varepsilon_{i}
- one dependent variable Y (the variable to be predicted)
- K independent variables X_{k}, for k=1 \dots K
- N different observations (X_{i},Y_{i}), for i=1 \dots N
- k+1 model coefficients \beta (one slope for each X_{k} plus a model intercept \beta_{0}) Y_{i} = \beta_{0} + \displaystyle\sum_{k=1}^{K} \left( \beta_{k} X_{ik} \right) +\varepsilon_{i}
1 predictor: a line in 2D
- Y_{i} = \beta_{0} + \beta_{1} X + \varepsilon_{i}
- one dependent variable Y
(the variable to be predicted) - one independent variable X
(the variable we are using to predict Y) - N different observations of
(X_{i},Y_{i}), for i=1 \dots N - two model coefficients:
- \beta_{0} (intercept)
- \beta_{1} (slope)

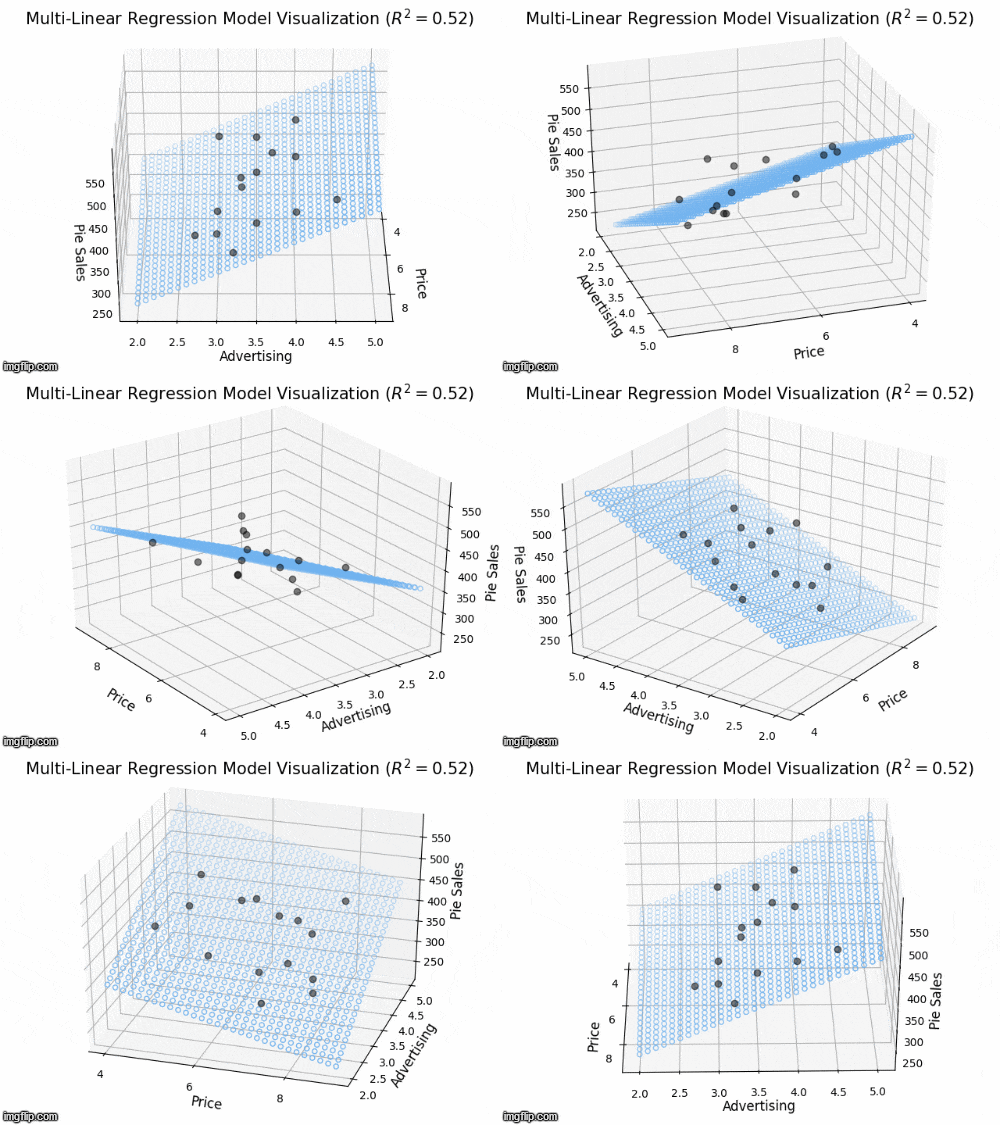
2 predictors: a 2D plane in 3D
- Y_{i} = \beta_{0} + \beta_{1} X_{i1} + \beta_{2} X_{i2} +\varepsilon_{i}
- Y: “Pie Sales”
- X_{1}: “Price”, X_{2} is “Advertising”
- \beta_{1}: dependence of Pie Sales (Y) on Price (X_{1})
- \beta_{2}: dependence of Pie Sales (Y) on Advertising (X_{2})
- \beta_{0}: predicted Pie Sales (Y) when Price and Advertising are both zero
- a 2D plane in 3D space
![]()
An Example: palmerpenguins

The penguins data from the palmerpenguins package contains size measurements for 344 penguins from three species observed on three islands in the Palmer Archipelago, Antarctica.
An Example: palmerpenguins
Rows: 344
Columns: 8
$ species           <fct> Adelie, Adelie, Adelie, Adelie, Adelie, Adelie, Adel…
$ island            <fct> Torgersen, Torgersen, Torgersen, Torgersen, Torgerse…
$ bill_length_mm    <dbl> 39.1, 39.5, 40.3, NA, 36.7, 39.3, 38.9, 39.2, 34.1, …
$ bill_depth_mm     <dbl> 18.7, 17.4, 18.0, NA, 19.3, 20.6, 17.8, 19.6, 18.1, …
$ flipper_length_mm <int> 181, 186, 195, NA, 193, 190, 181, 195, 193, 190, 186…
$ body_mass_g       <int> 3750, 3800, 3250, NA, 3450, 3650, 3625, 4675, 3475, …
$ sex               <fct> male, female, female, NA, female, male, female, male…
$ year <int> 2007, 2007, 2007, 2007, 2007, 2007, 2007, 2007, 2007…- can we predict
body_mass_gofAdeliepenguins using a model that includes:flipper_length_mmbill_length_mmbill_depth_mm
An Example: palmerpenguins
- gather variables we need —
dplyr() - examine correlations to get a first impression —
GGally::ggpairs() - build a “full model” —
lm() - check assumptions
- refine the model (kick out non-useful X variables) —
step() - interpret the model
1. Gather variables
pdata <- penguins %>%
  filter(species == "Adelie") %>%
  select(body_mass_g, flipper_length_mm, bill_length_mm, bill_depth_mm) %>%
  drop_na() # skips rows containing NA values (indicating missing data)
glimpse(pdata)
Rows: 151
Columns: 4
$ body_mass_g <int> 3750, 3800, 3250, 3450, 3650, 3625, 4675, 3475, 4250…
$ flipper_length_mm <int> 181, 186, 195, 193, 190, 181, 195, 193, 190, 186, 18…
$ bill_length_mm <dbl> 39.1, 39.5, 40.3, 36.7, 39.3, 38.9, 39.2, 34.1, 42.0…
$ bill_depth_mm <dbl> 18.7, 17.4, 18.0, 19.3, 20.6, 17.8, 19.6, 18.1, 20.2…- we have 151 observations (penguins)
- each has 4 variables
- we want to predict
body_mass_gbased on the other threeflipper_length_mm,bill_length_mm, andbill_depth_mm
2. Look at correlation matrix

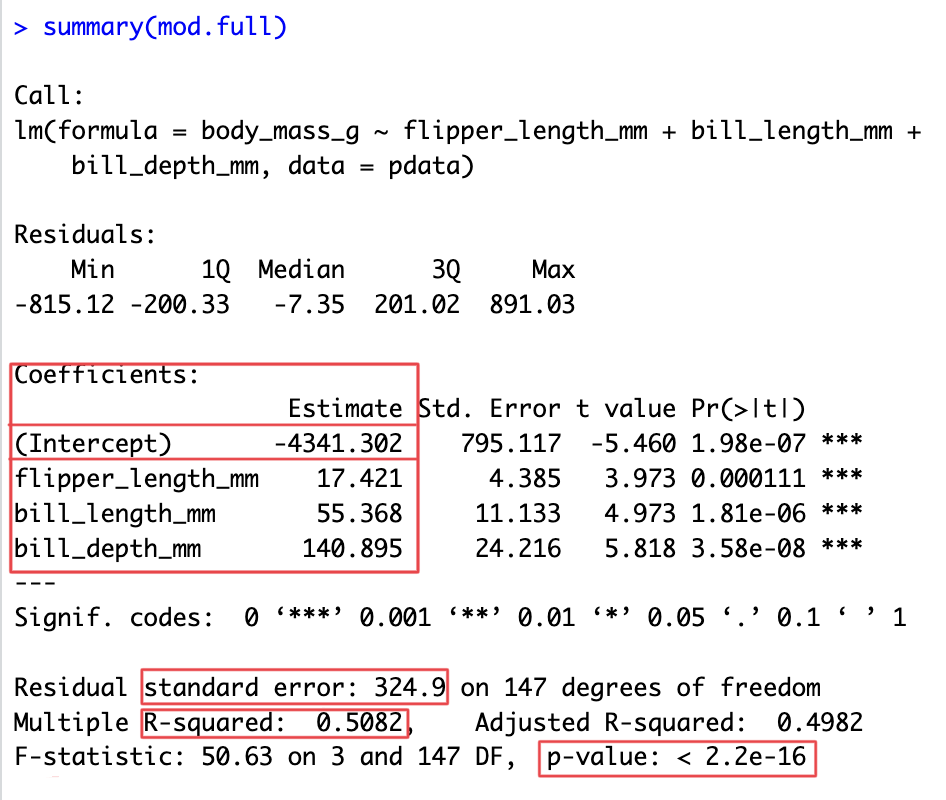
3. Build a full model
- “full” means we include all independent variables X_{k} in the model
mod.full <- lm(body_mass_g ~ flipper_length_mm + bill_length_mm + bill_depth_mm, data=pdata)
summary(mod.full)
Call:
lm(formula = body_mass_g ~ flipper_length_mm + bill_length_mm +
    bill_depth_mm, data = pdata)

Residuals:
    Min      1Q  Median      3Q     Max
-815.12 -200.33   -7.35  201.02  891.03

Coefficients:
                   Estimate Std. Error t value Pr(>|t|)
(Intercept)       -4341.302    795.117  -5.460 1.98e-07 ***
flipper_length_mm    17.421      4.385   3.973 0.000111 ***
bill_length_mm       55.368     11.133   4.973 1.81e-06 ***
bill_depth_mm       140.895     24.216   5.818 3.58e-08 ***
---
Signif. codes:  0 '***' 0.001 '**' 0.01 '*' 0.05 '.' 0.1 ' ' 1

Residual standard error: 324.9 on 147 degrees of freedom
Multiple R-squared:  0.5082,    Adjusted R-squared:  0.4982
F-statistic: 50.63 on 3 and 147 DF,  p-value: < 2.2e-16
4. Check assumptions
- check the linearity assumption
- plot the fitted values against the residuals—no obvious indication of non-linearity
4. Check assumptions
- check the normality assumption
- produce a Q-Q plot—no obvious indication of non-linearity
4. Check assumptions
- check the normality assumption
- conduct a
shapiro.test()on the residuals - H_{0} is that the population residuals are normally distributed
- p = 0.6645 so we do not reject H_{0}
- no evidence we have violated the normality assumption
4. Check assumptions
- check the homoscedasticity assumption
- look at plot of residuals—no sign of variance change across range
4. Check assumptions
- check the homoscedasticity assumption
- conduct a non-constant variance test (
ncvTest()in thecarpackage) - H_{0} is that the population residuals have constant variance
- p = 0.11762 so we do not reject H_{0}
- no evidence of violation of homoscedasticity
4. Collinearity
- See Navarro 15.9.6 for ways to check for collinearity
- variance inflation factors VIFs
- familiarize yourself with the concept if not the details
5. Interpret the model
5. Interpret the model
5. Interpret the model
- Let’s use the
broompackage totidythe model object into atibble - why??
- so that we can more easily plot the coefficients (slopes) and their confidence intervals
- why?
- we dont’ have to … but it’s a nicer way of visualizing them compared to a table
library(broom) # you will need to first install.packages("broom") once
mod.tidy <- tidy(mod.full, conf.int=TRUE, conf.level=0.95)
mod.tidy
# A tibble: 4 × 7
term estimate std.error statistic p.value conf.low conf.high
<chr> <dbl> <dbl> <dbl> <dbl> <dbl> <dbl>
1 (Intercept) -4341. 795. -5.46 0.000000198 -5913. -2770.
2 flipper_length_mm 17.4 4.39 3.97 0.000111 8.76 26.1
3 bill_length_mm 55.4 11.1 4.97 0.00000181 33.4 77.4
4 bill_depth_mm 141. 24.2 5.82 0.0000000358 93.0 189. 5. Interpret the model
- let’s remove the
(Intercept)term from the model output - why?
- in a multiple regression the intercept is not so informative
- we’re mainly interested in the slopes — the effect of flipper length, bill length, and bill depth on penguin weight
# A tibble: 3 × 7
  term              estimate std.error statistic      p.value conf.low conf.high
  <chr>                <dbl>     <dbl>     <dbl>        <dbl>    <dbl>     <dbl>
1 flipper_length_mm     17.4      4.39      3.97 0.000111         8.76      26.1
2 bill_length_mm        55.4     11.1       4.97 0.00000181      33.4       77.4
3 bill_depth_mm        141.      24.2       5.82 0.0000000358    93.0      189.
5. Interpret the model
# A tibble: 3 × 7
  term              estimate std.error statistic      p.value conf.low conf.high
  <chr>                <dbl>     <dbl>     <dbl>        <dbl>    <dbl>     <dbl>
1 flipper_length_mm     17.4      4.39      3.97 0.000111         8.76      26.1
2 bill_length_mm        55.4     11.1       4.97 0.00000181      33.4       77.4
3 bill_depth_mm 141. 24.2 5.82 0.0000000358 93.0 189. - plot model coefficients (slopes) relative to zero

5. Interpet the model
- OR: You can use the
coefplotpackage to more easily plot coefficients and their confidence intervals - just pass it your
lm()model object

6. Refine the model
- We have our “full model”
- “full” because it includes all of our predictor (X) variables
- Q: is this the “best” model?
- Q: do we need all 3 variables?
- Q: do all three variables explain unique portions of the variance in
body_mass_g?- collinearity (see Chapter 9 of OpenIntroStats, & Chapter 15.9.6 / 15.10 of Learning Statistics with R)
6. Refine the model
- principle of parsimony in science
- all other things being (almost) equal, a model with fewer predictor variables is better than a model with many predictor variables
- simpler explanations (models) are preferred to complex ones
6. Refine the model
- statistical/mathematical reasons
- often multiple predictor variables (X_{k}) are correlated with each other
- adding multiple correlated variables to a model doesn’t help much
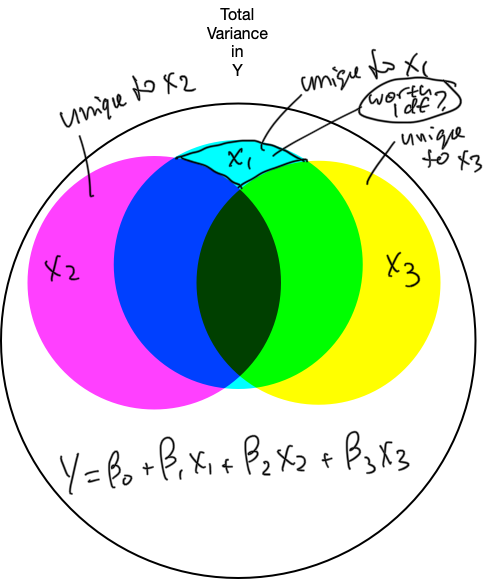
- each time you add an X variable you have to “pay” using a degree of freedom
- fewer degrees of freedom in your model means a larger denominator in your F or t ratios
- then it’s more difficult to reliably say a model coefficient is significant (different from zero)
6. Refine the model: unique variance
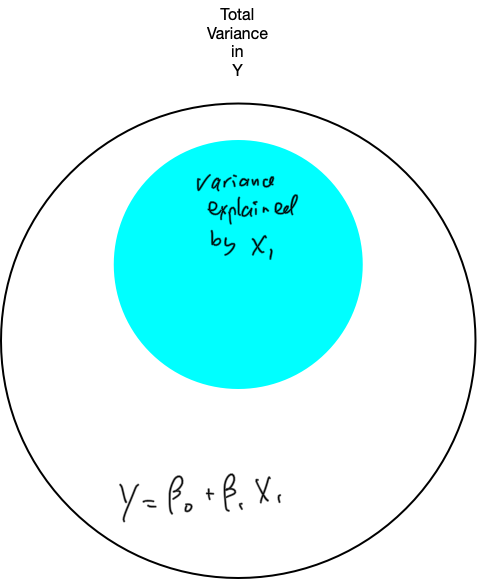
6. Refine the model: unique variance
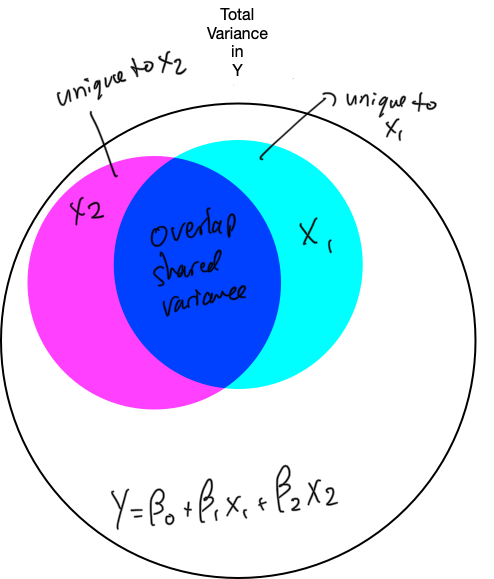
6. Refine the model: unique variance
6. Refine the model
- recall the significance test of the model “as a whole”:
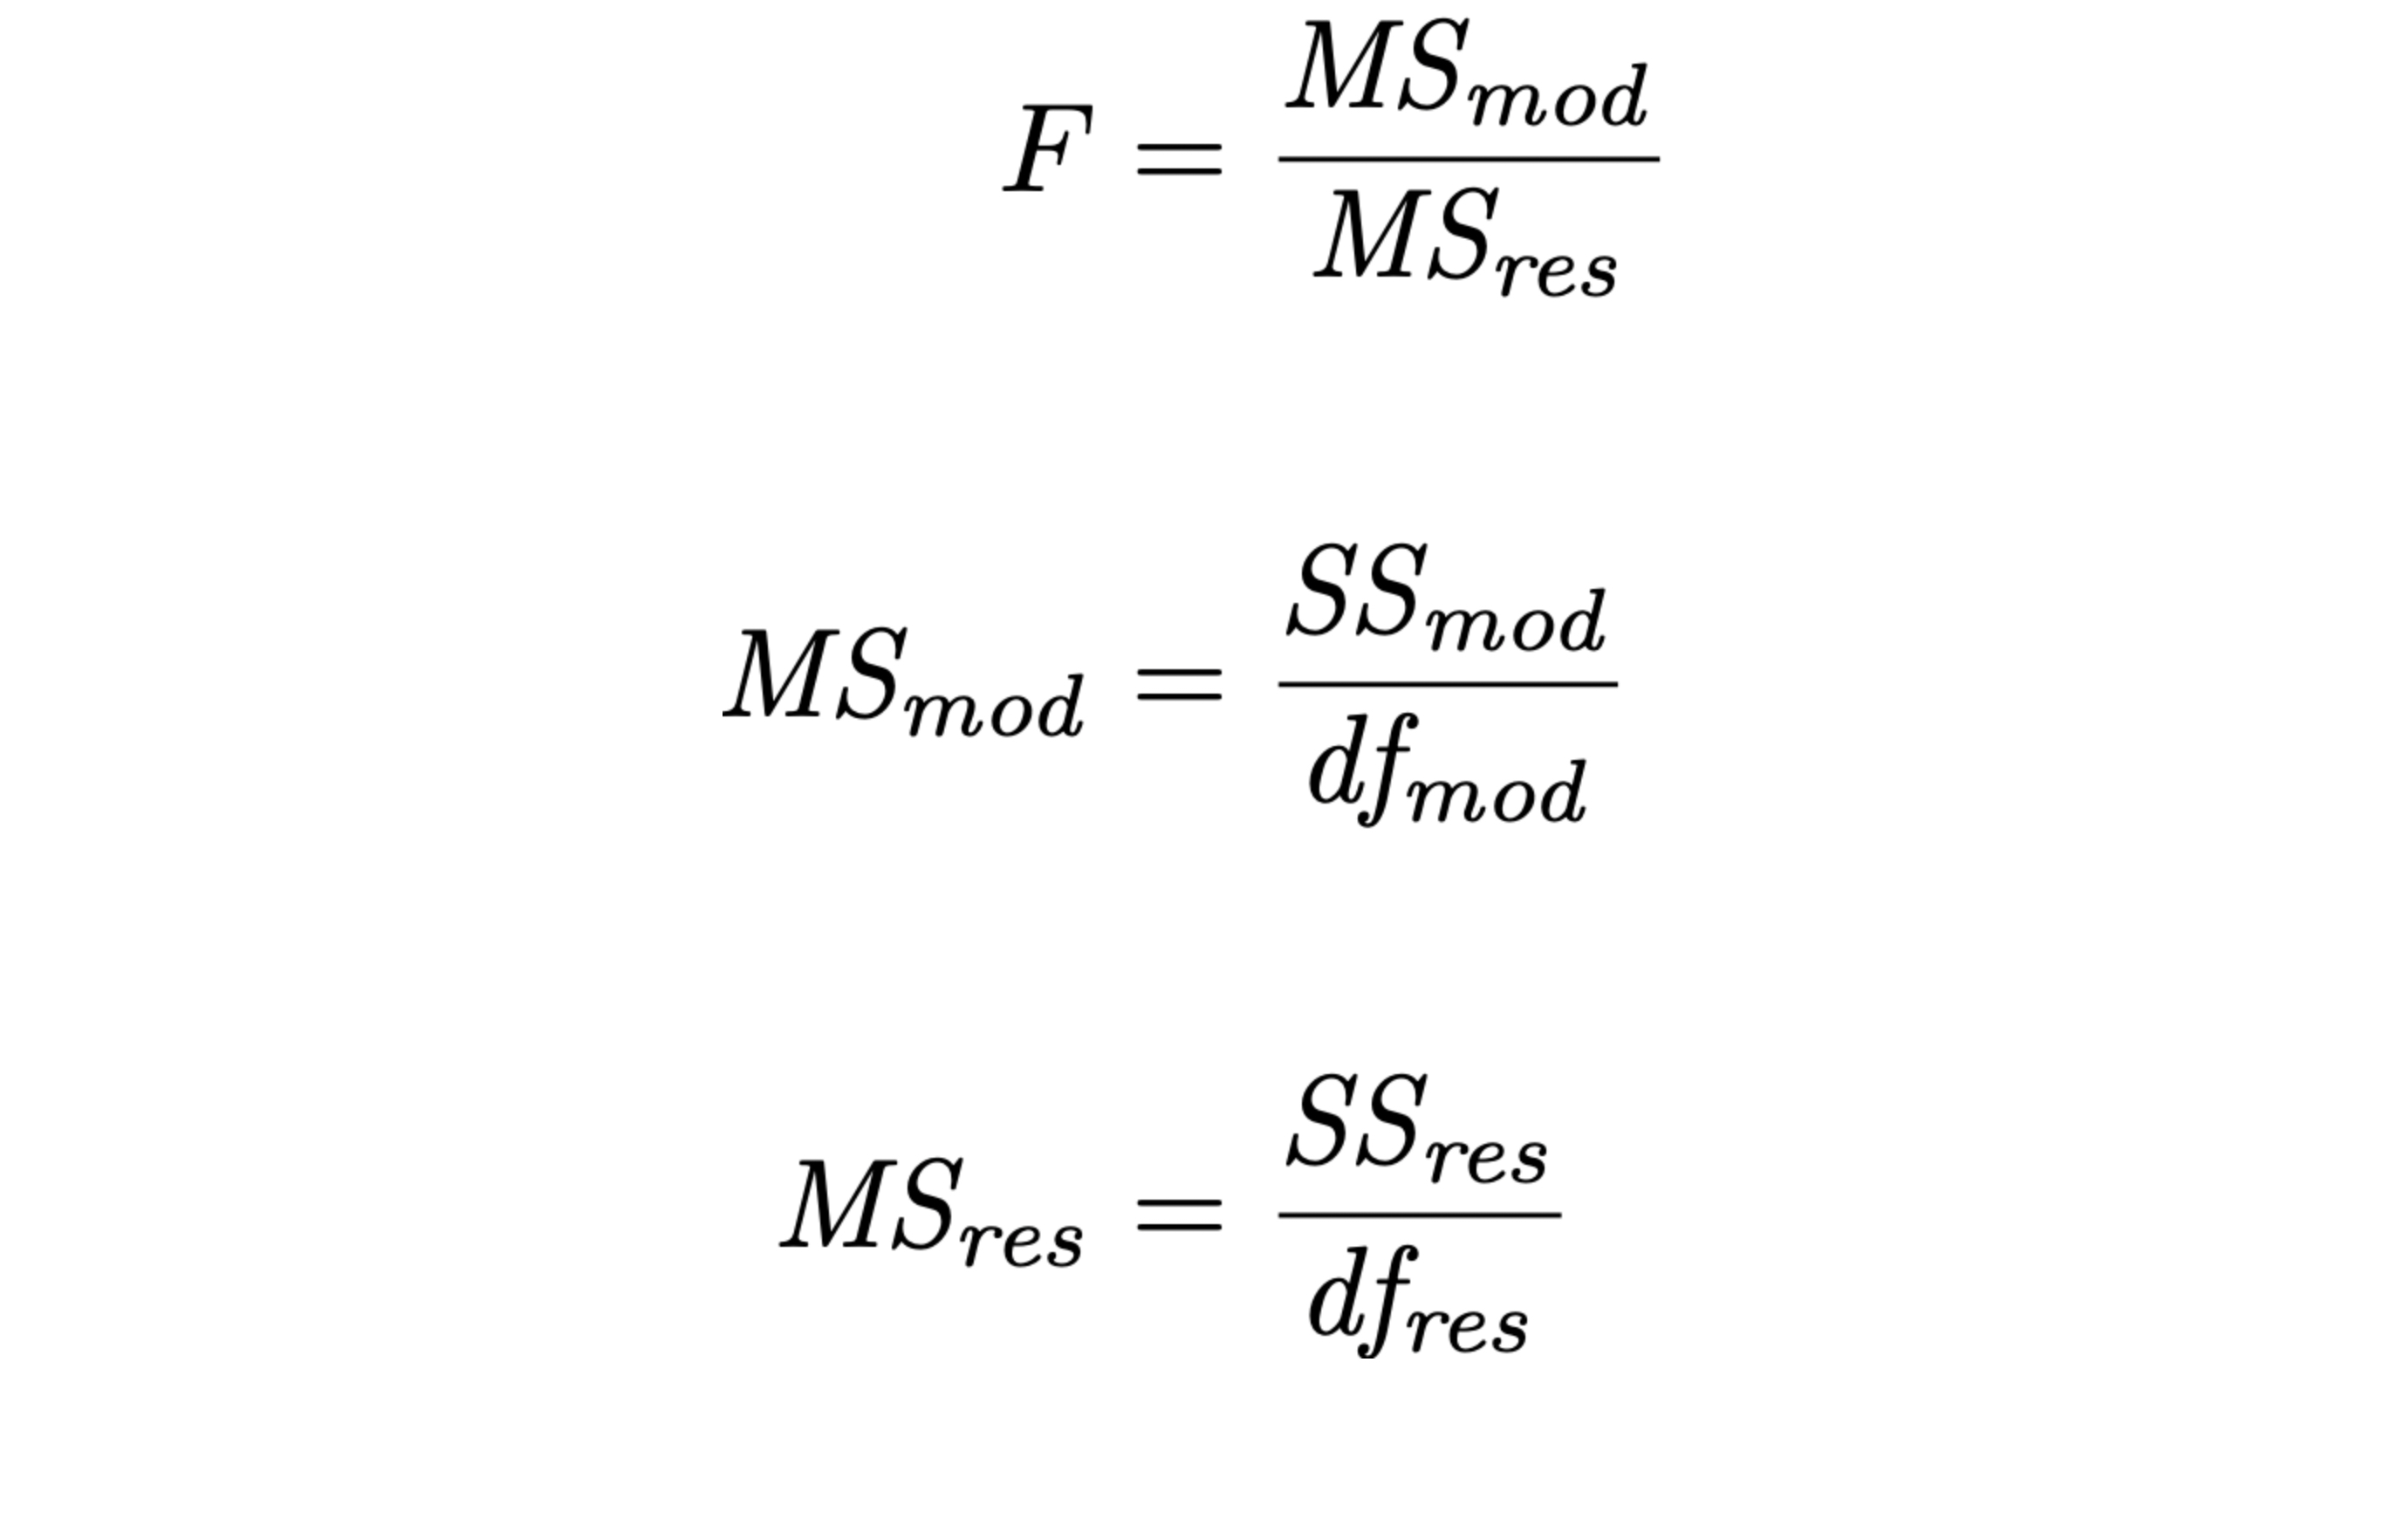
6. Refine the model
- recall the significance test of the model “as a whole”:
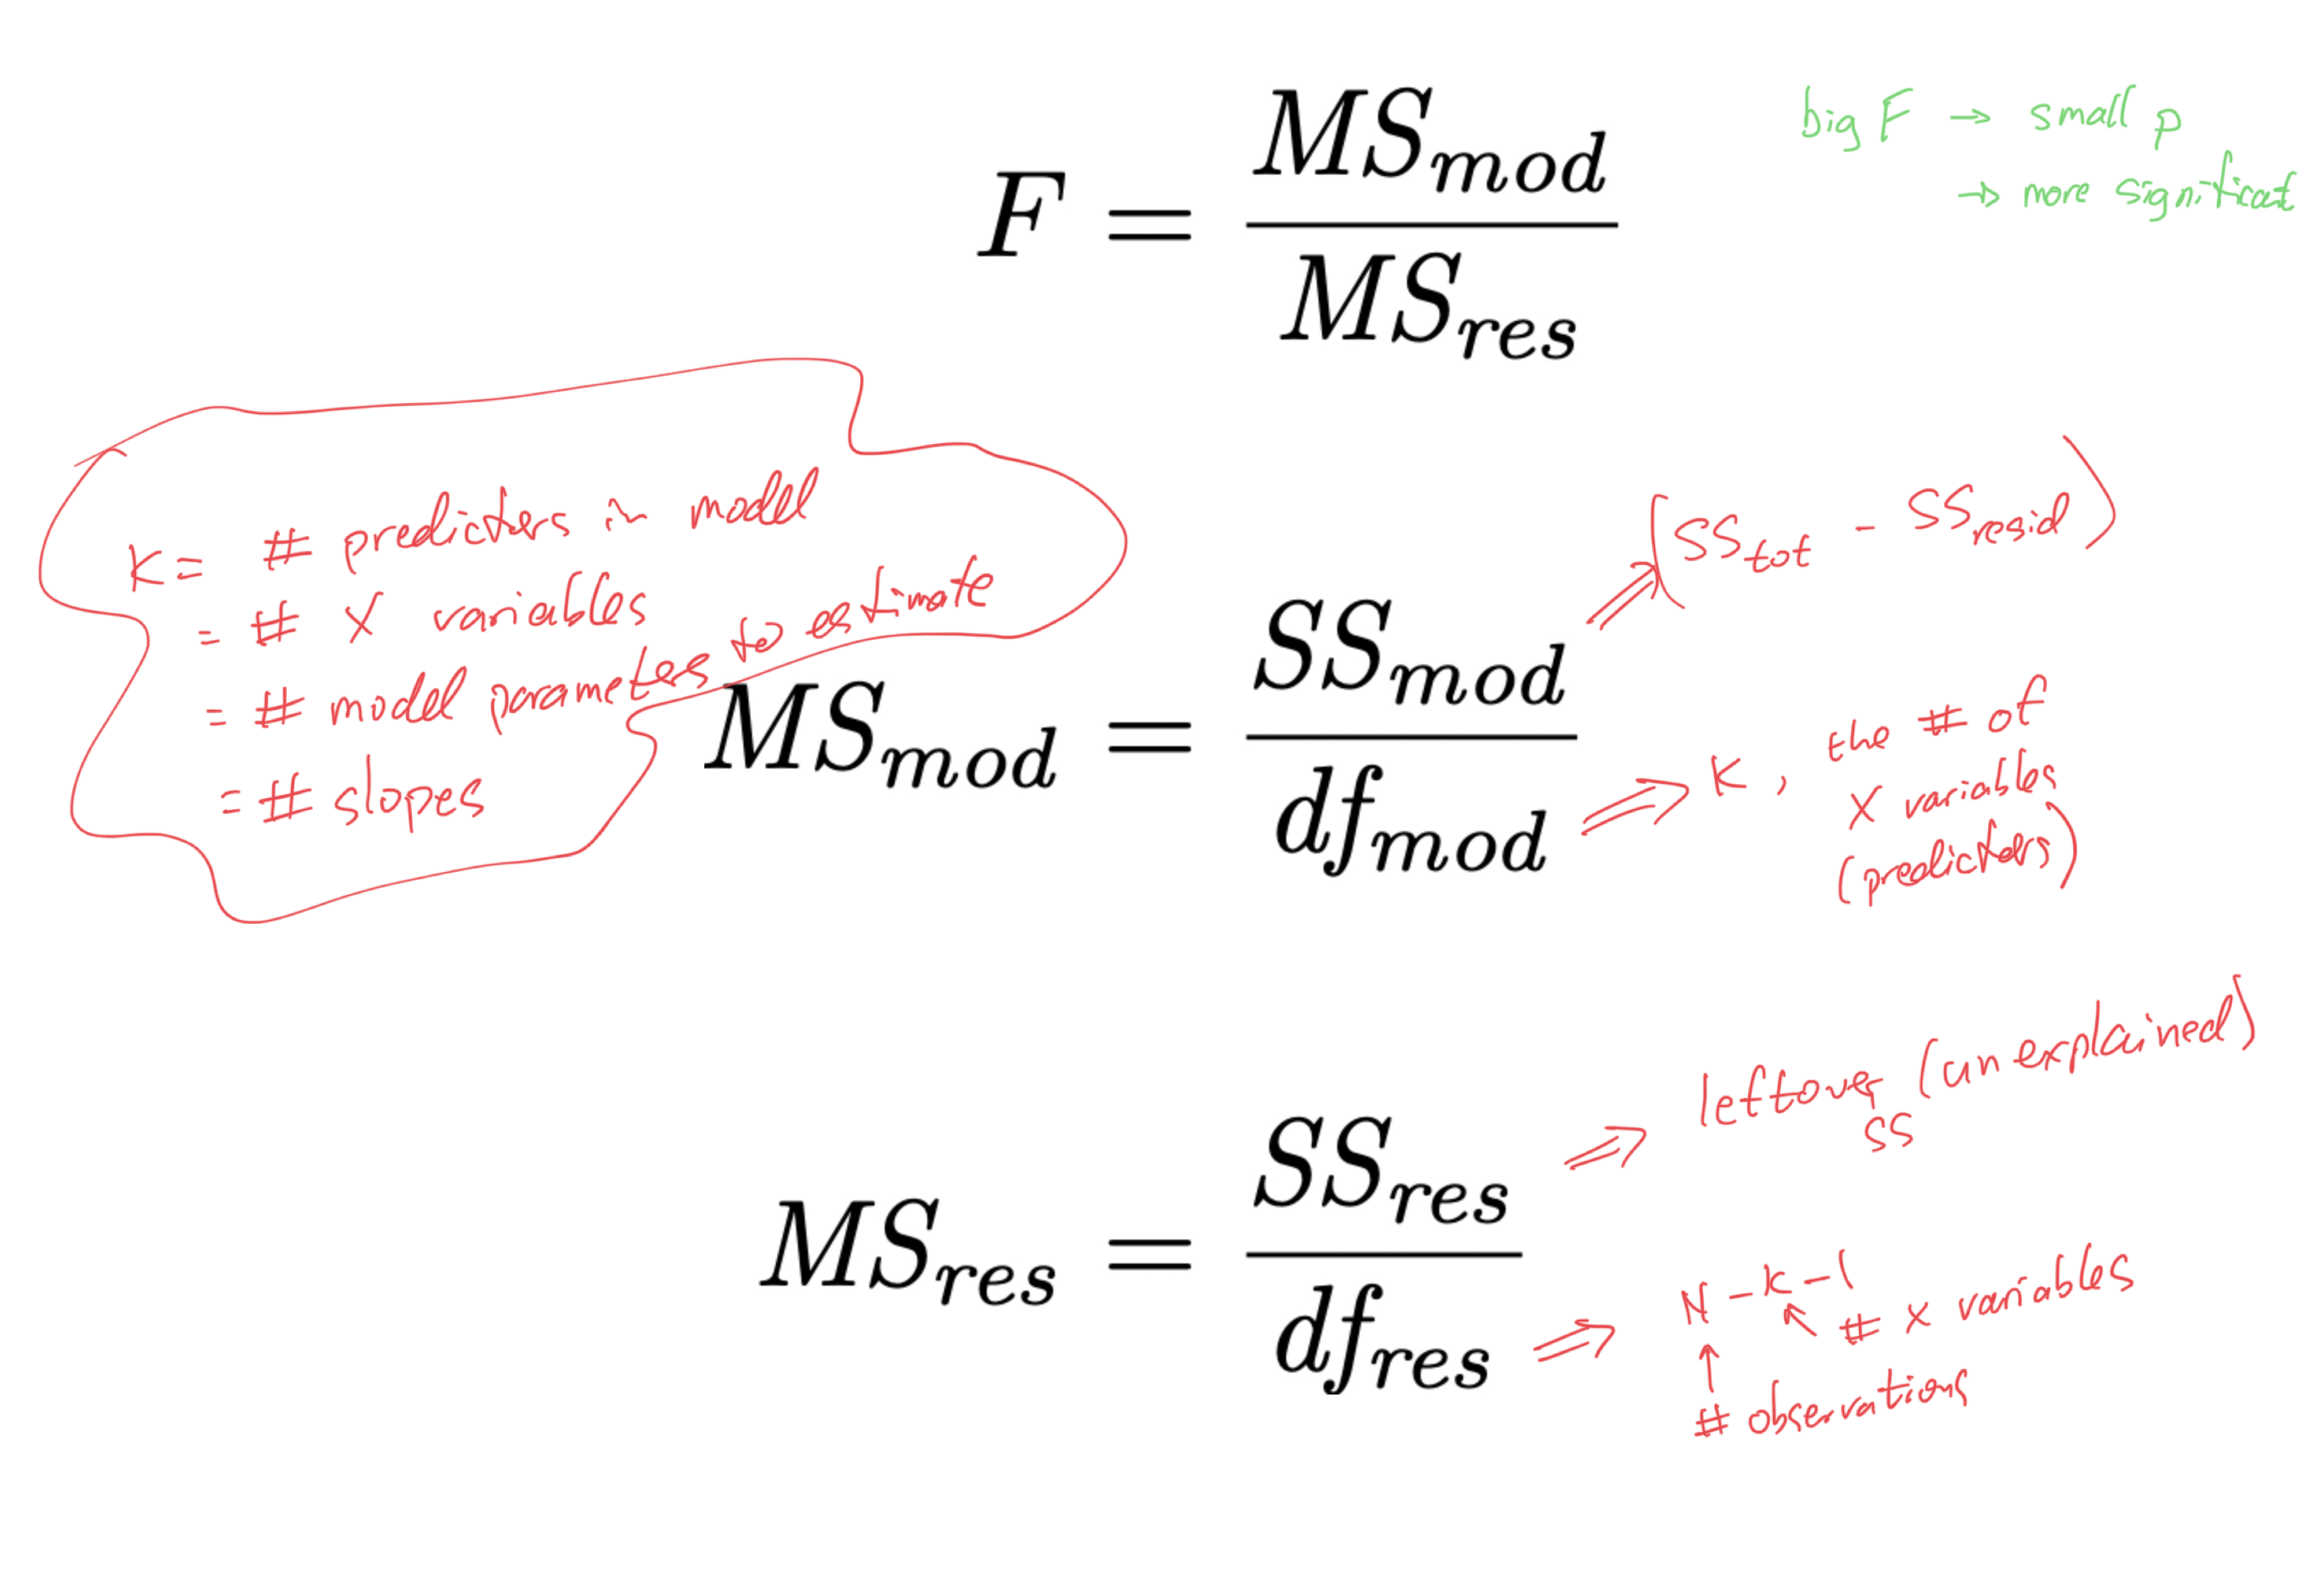
6. Refine the model
- recall the significance test of the model “as a whole”:
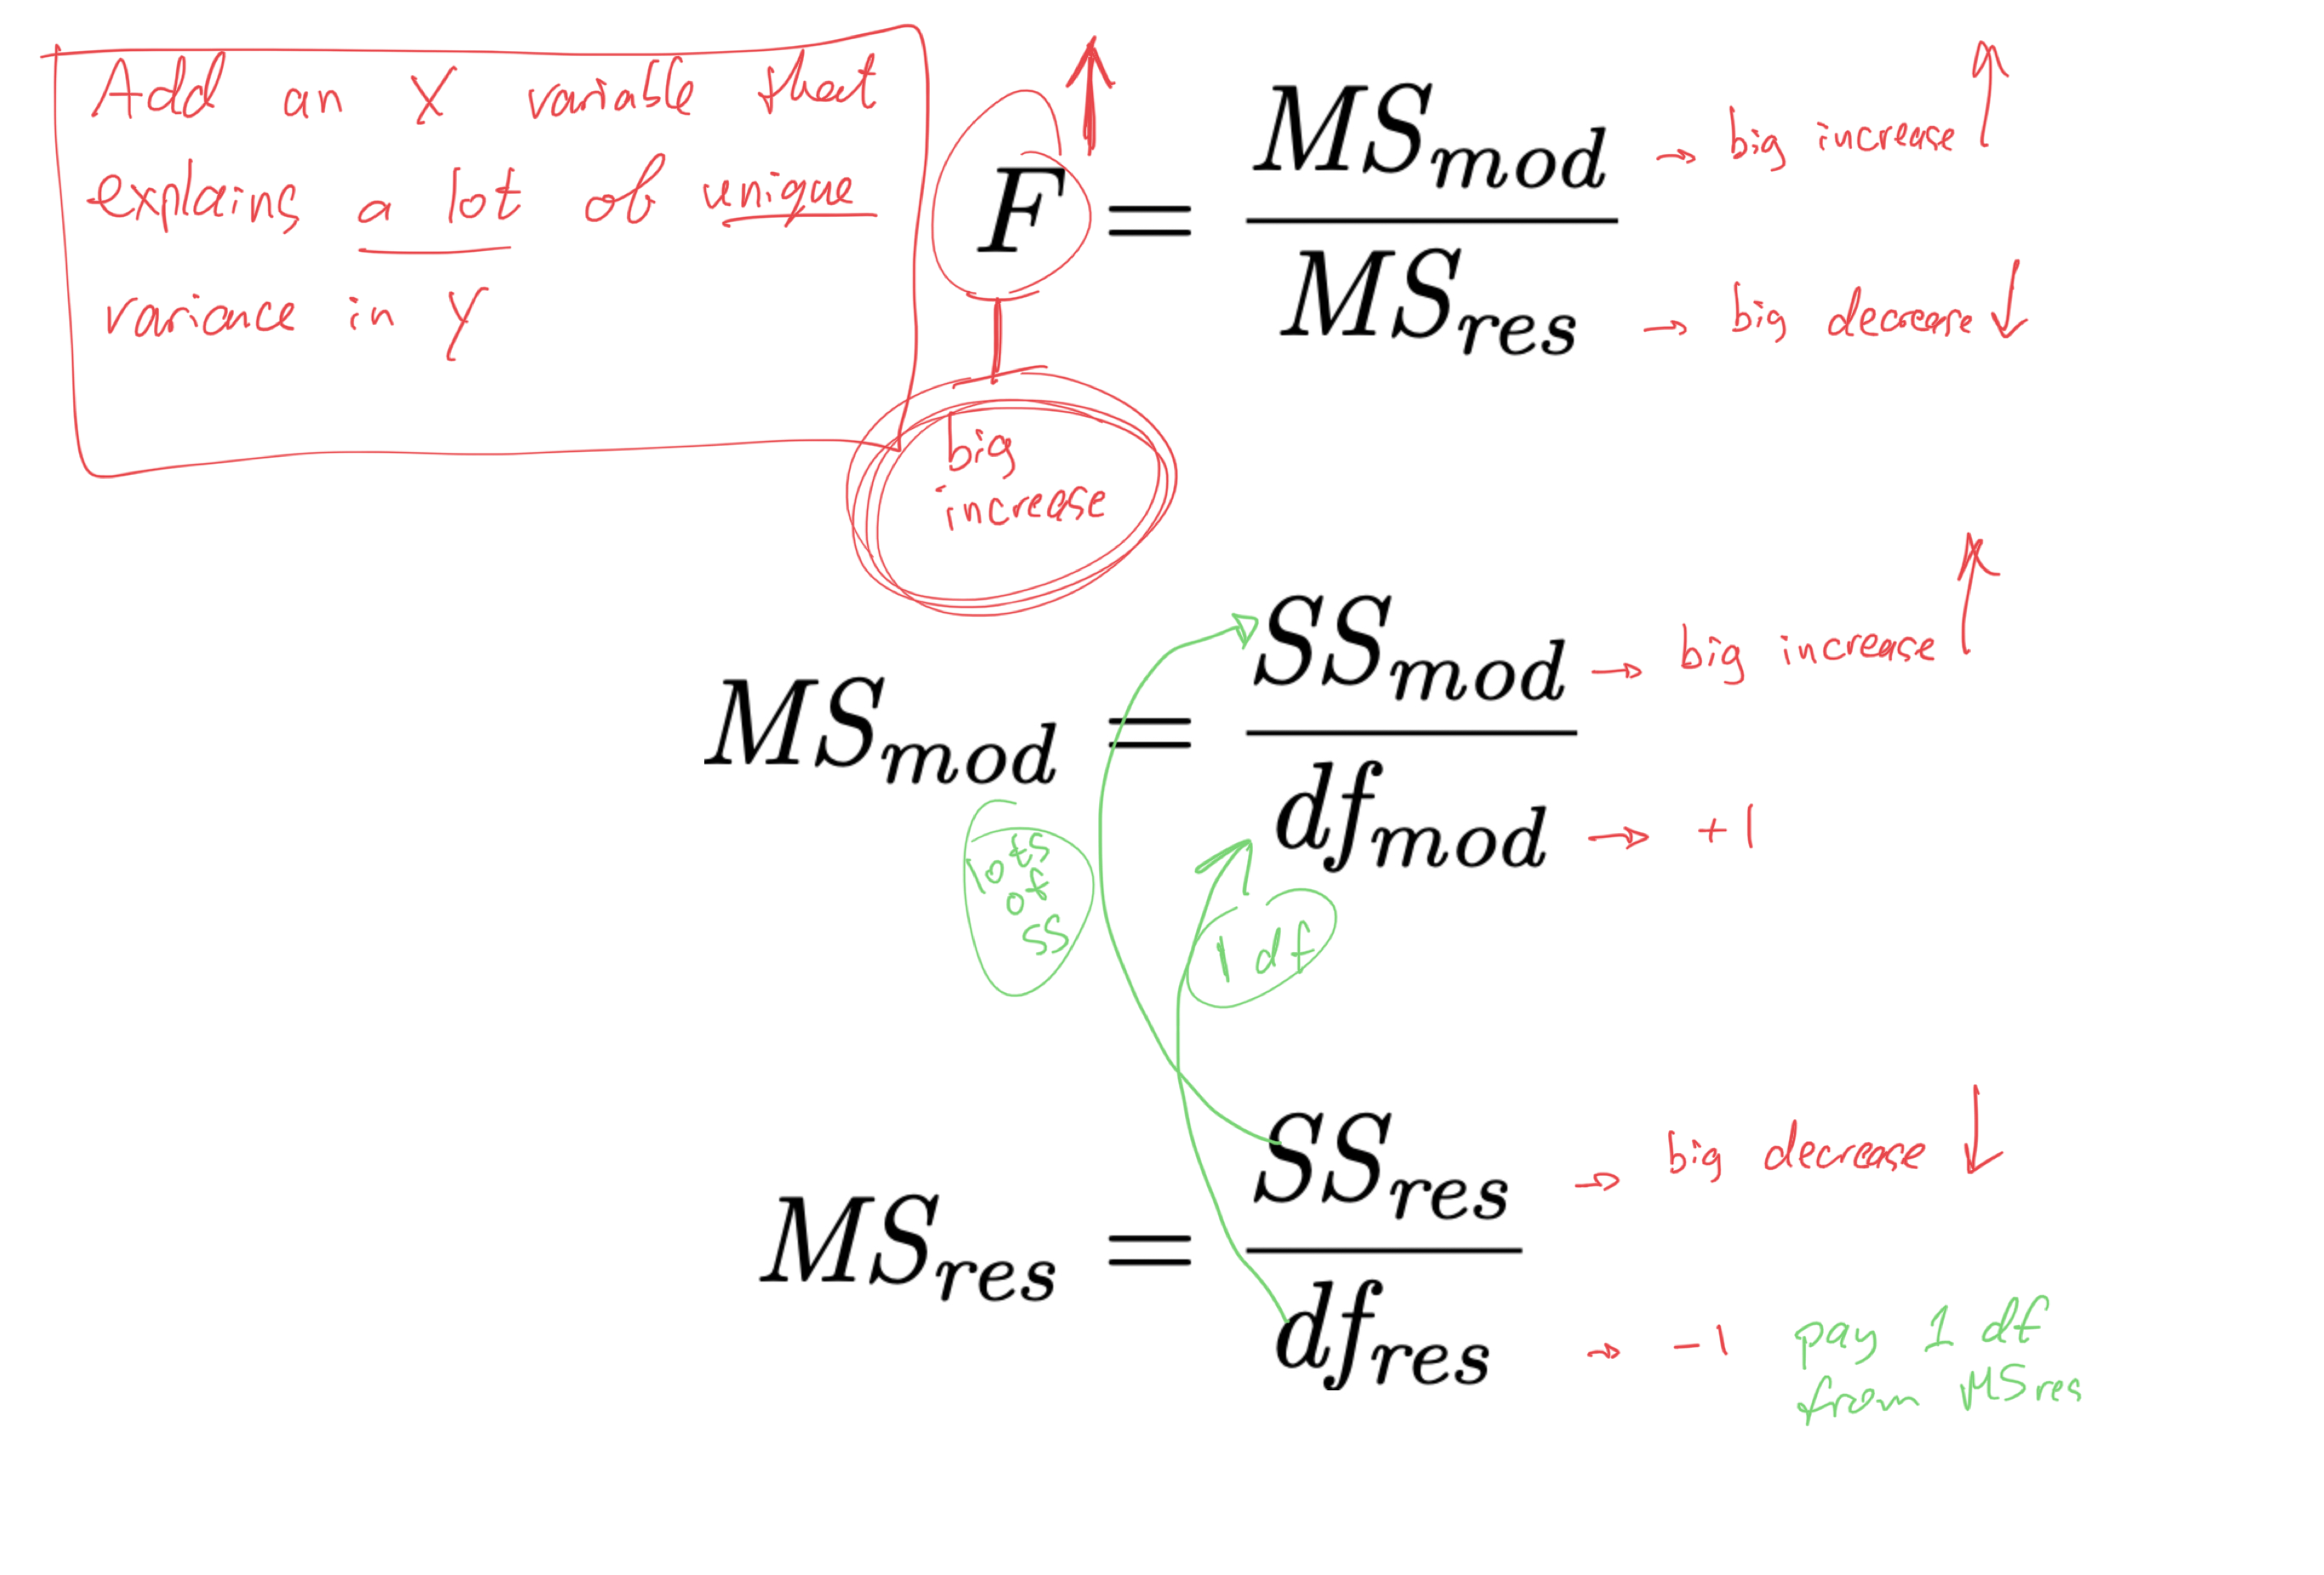
6. Refine the model
- recall the significance test of the model “as a whole”:
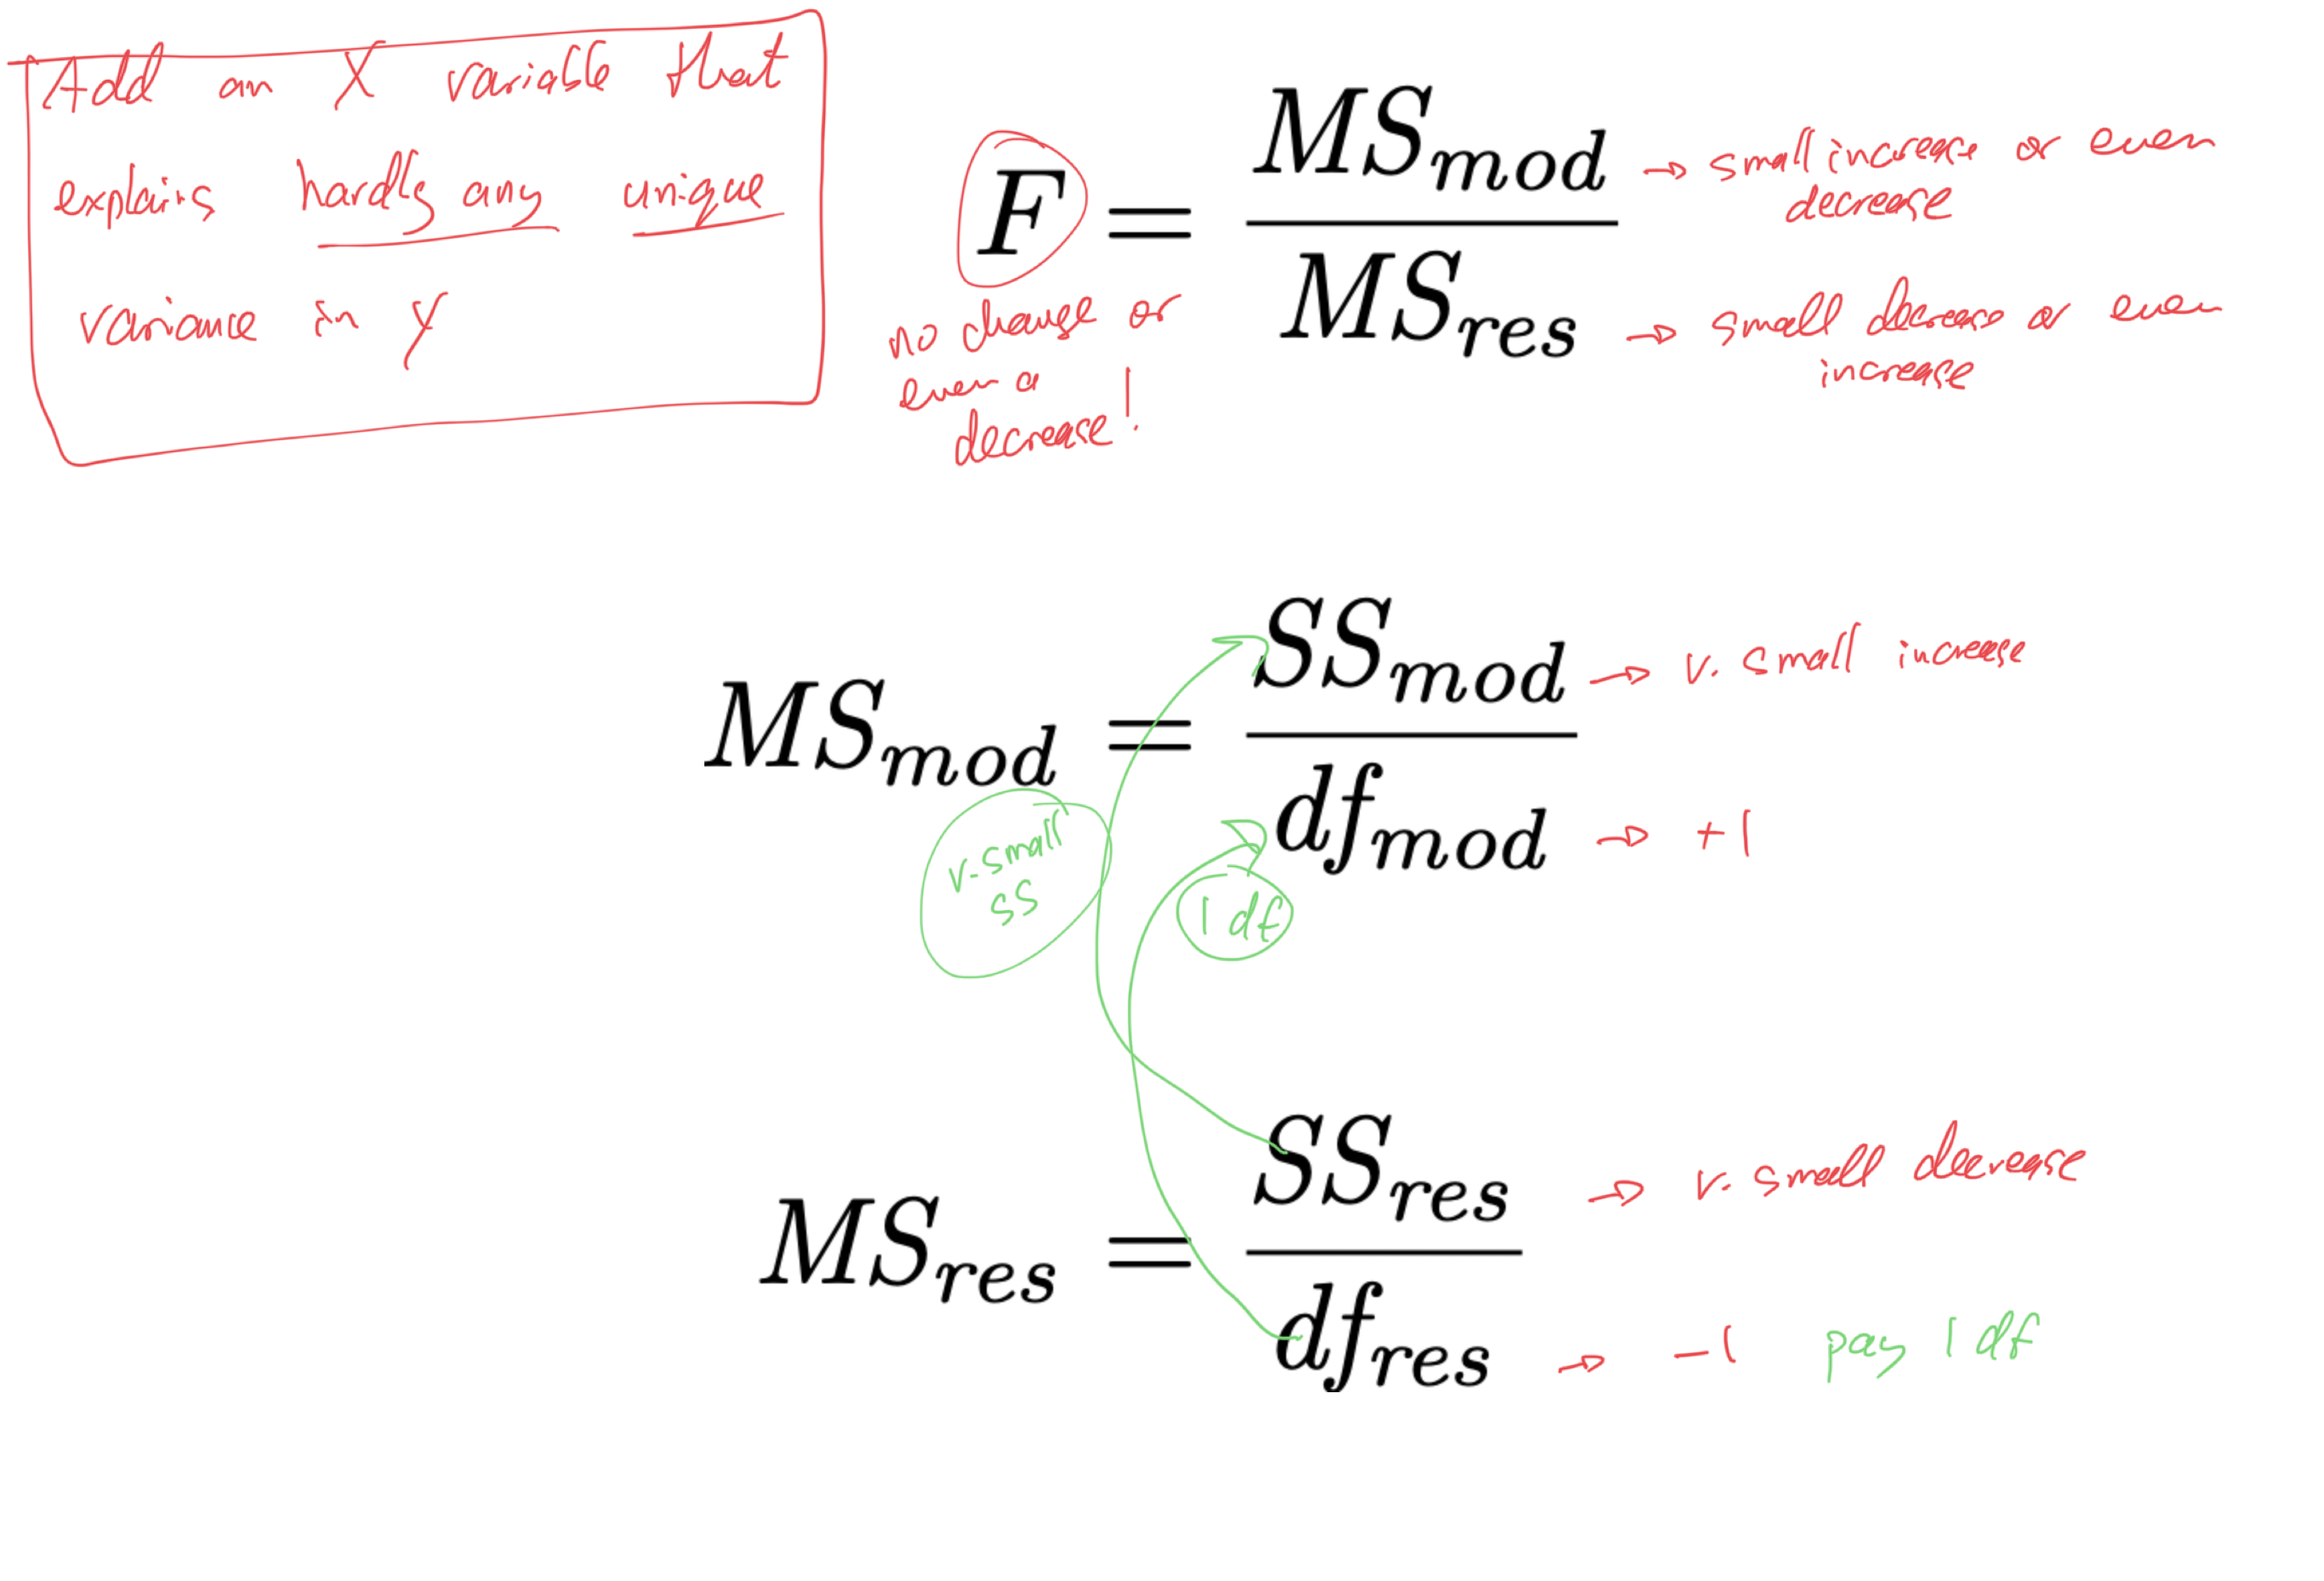
6. Refine the model
- when we add an X variable to the model,
- we “pay” by taking 1 df out of MSres
- smaller MSres denominator means larger MSres
- larger MSres means smaller F
- smaller F means larger p
- larger p means less significant
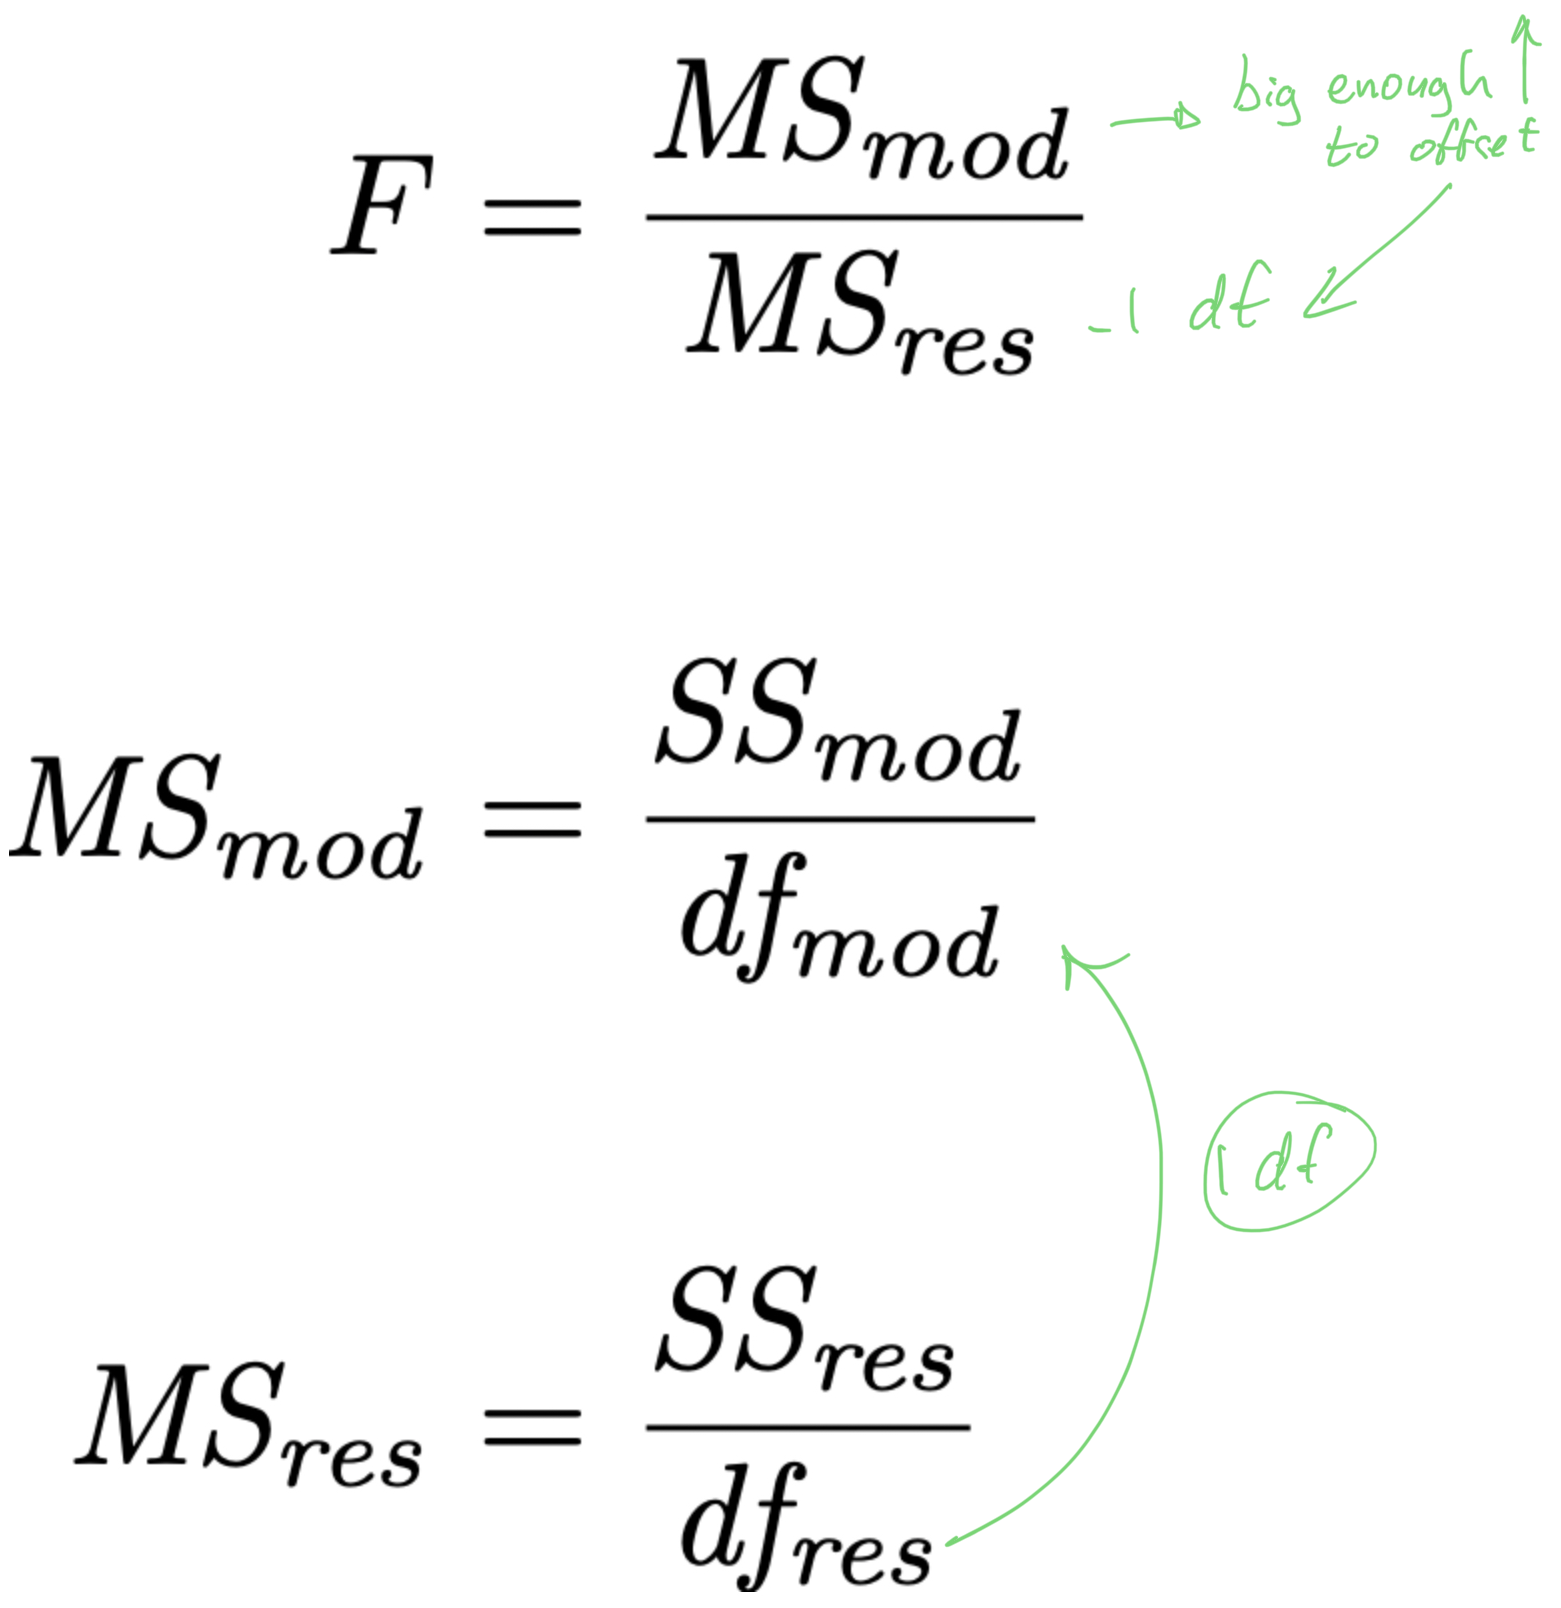
- if we are to “pay” 1 df from the MSres denominator, to make it worth it,
- the X variable should explain a lot of unique variance in Y
- it should increase SSmod and decrease SSres enough to offset the increase in MSres caused by the removal of 1 df
6. Refine the model
- if we are to “pay” 1 df from the MSres denominator, to make it worth it,
- the X variable should explain enough unique variance in Y
- it should increase SSmod and decrease SSres enough to offset the change in MSres caused by the removal of 1 df
- how much is “enough”?
- how much unique variance does an X variable need to explain in order to offset having to “pay” with 1 df from the error term (from MSres)?

6. Refine the model
- There exist several reasonable ways of quantitatively assessing whether or not to include a variable in your model:
- adjusted R^{2}
- Akaike information criterion (AIC) (this is used by default in R’s
step()function) - p-values for individual coefficients
- F-tests
- all share same procedural concept—compare:
- full model containing all X variables with
- reduced model in which the X variable being tested is removed
- Q: is the full model better than the reduced model?
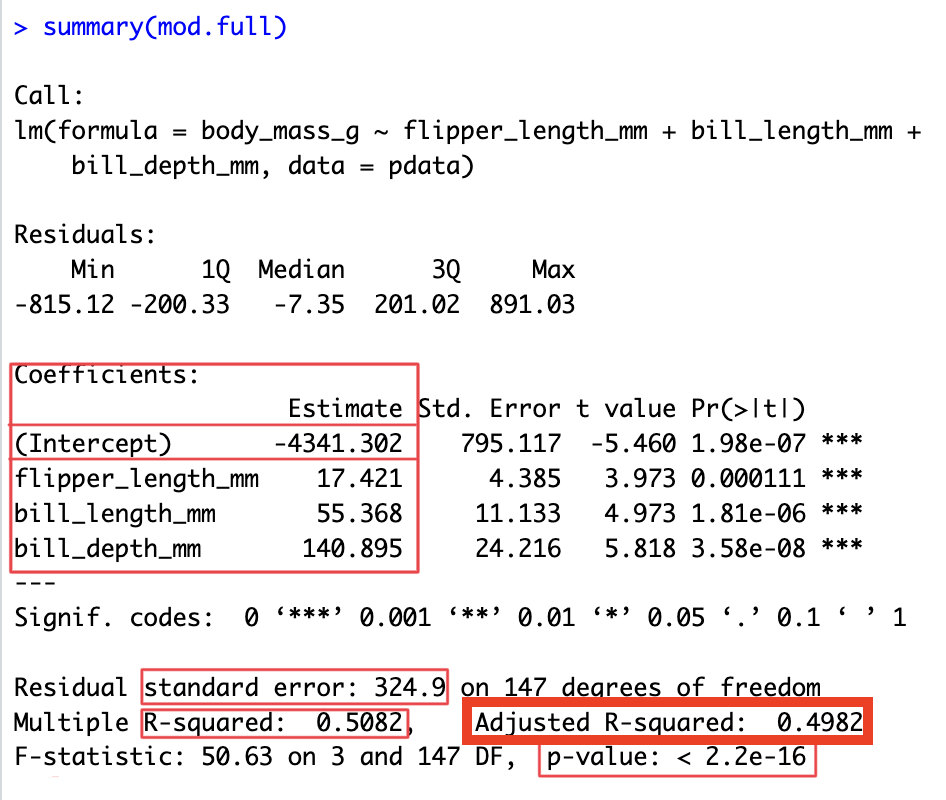
6. Refine the model: Adj. R^{2}

R^{2} = 1 - \frac{\mathit{SS_{res}}}{\mathit{SS_{tot}}} \text{adj.}R^{2} = 1 - \left( \frac{\mathit{SS_{res}}}{\mathit{SS_{tot}}} \times \frac{N-1}{N-K-1} \right)
- adding predictors to model will always increase R^{2}
- takes into account the number of parameters (X variables) K
- adj. R^{2} will only increase if the new X variable improves the model performance more than what you’d expect by chance
6. Refine the model: Adj. R^{2}
- start with a full model:
mod.full <- lm(body_mass_g ~ flipper_length_mm + bill_length_mm + bill_depth_mm, data=pdata)
summary(mod.full)$adj.r.squared
[1] 0.4981588- then remove a variable (
bill_depth_mm) and see what effect it has on adjusted r-squared
mod.red <- lm(body_mass_g ~ flipper_length_mm + bill_length_mm, data=pdata)
summary(mod.red)$adj.r.squared
[1] 0.3867675- adj. R^{2} goes down when we remove
bill_depth_mmto the model so we should keep it, it’s “worth it”
Refine the model: AIC
AIC \approx \frac{\mathit{SS_{res}}}{\hat{\sigma}^{2}} + 2K
- better models have low \mathit{SS_{res}} and smallest K
- lower AIC values are better
6. Refine the model: AIC
- start with a full model:
- use R’s
step()function to test competing models and look at AIC measure step()can do 3 flavours of model refinement:- forward: start with an empty model and add variables one at a time
- backward: start with a full model and remove variables one at a time
- “both”: allow
step()to add or remove variables at each step
- why “both”???
6. Refine the model: unique variance

6. Refine the model: unique variance

6. Refine the model: unique variance

6. Refine the model: AIC (live demo)
- define a full model
- define an empty model (no variables, only an intercept)
- issue the
step()command, start with empty model
- you’ll see a long list of output (try this in your own RStudio session)
step()starts withmod.0and adds the best single variable that most reduces AIC- then next best variable
- then checks to see if dropping any variables currently in the model helps
- then checks to see if new variables not in the model helps
- keeps going until no more improvements are possible
6. Refine the model: AIC (live demo)
- define a full model
- define an empty model (no variables, only an intercept)
- issue the
step()command, start with full model
- this time
step()starts with a full model and checks if dropping any single variable improves (reduces) AIC - it finds out nope! dropping any single variable only makes things worse
- so it stops
6. Refine the model
- AIC, p-values, Adj. R^{2}, forward, backward, steps, …
- how to decide what to do?
- no single correct answer
- these are different approaches to achieve the same outcome
- always a gray zone
- report what you did, make sure things make sense
- in homeworks / exams I will specify what procedure I would like
Prediction
- We can use the model to make predictions
- A new penguin is observed:
flipper_length_mm = 200 mmbill_length_mm = 46 mmbill_depth_mm = 22 mm
- how much does it weigh according to our model?
Prediction
- create a tibble with the new penguin’s data
- use
predict()to predict the value ofbody_mass_g
- the penguin is predicted to weigh 4789.586 g
- standard error of the estimate is 324.9 g
fromsummary(mod.refined)
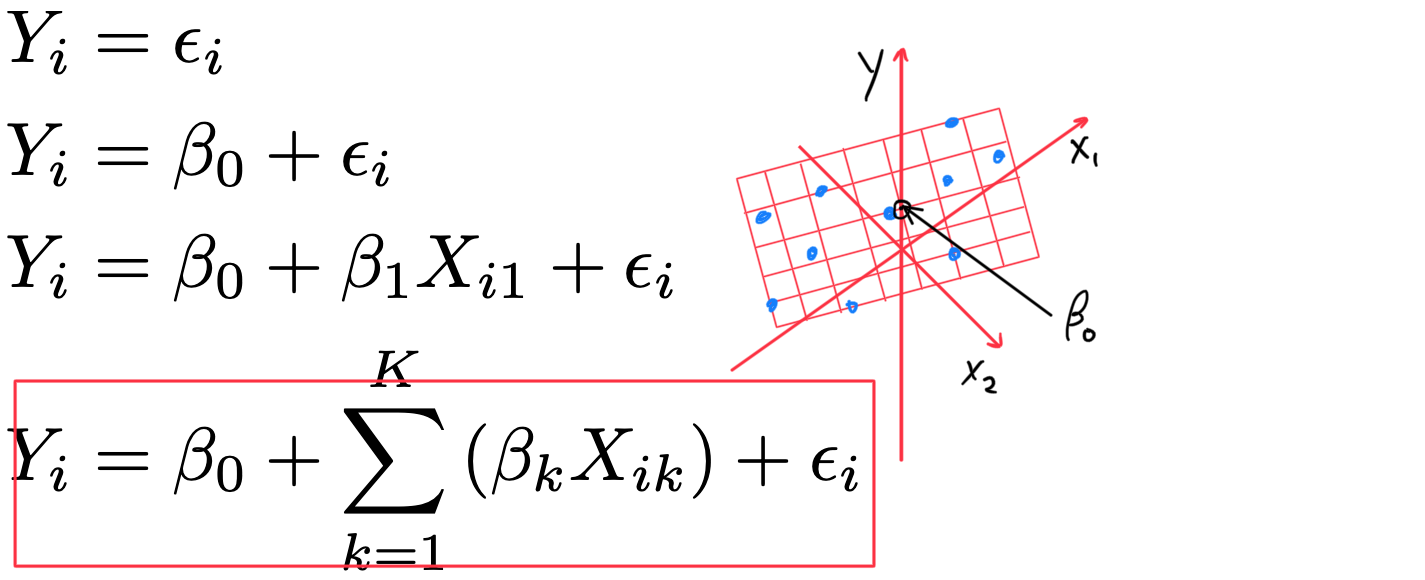
Linear Models
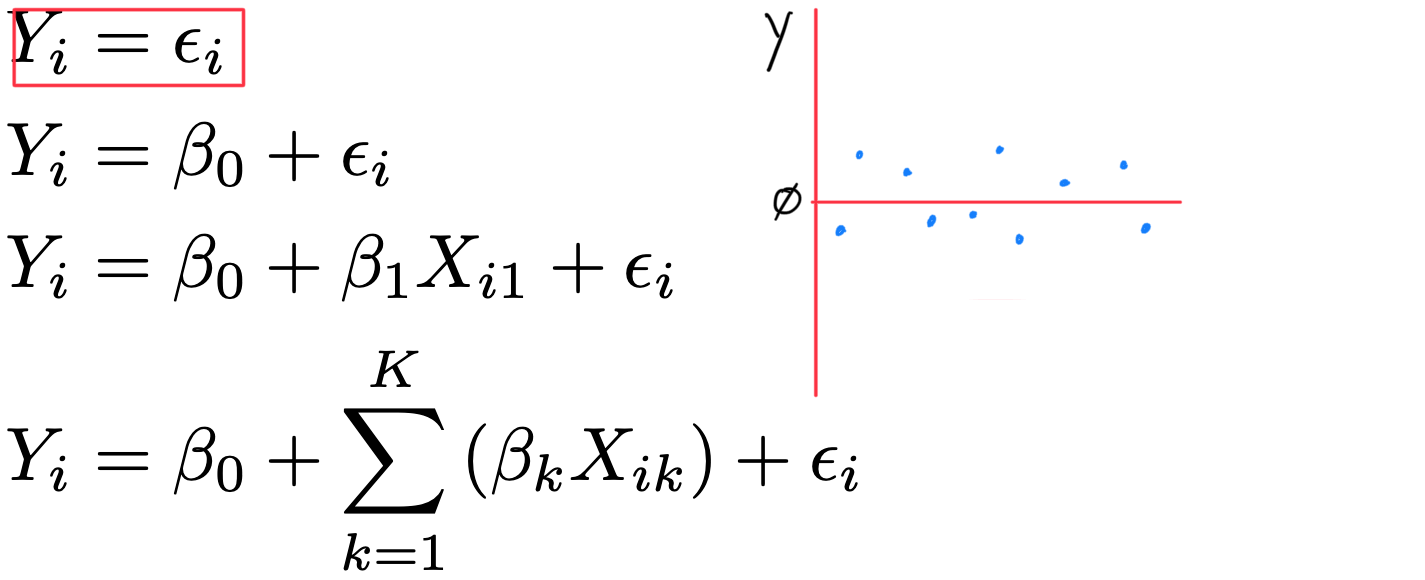
- Y_{i} = \varepsilon_{i}
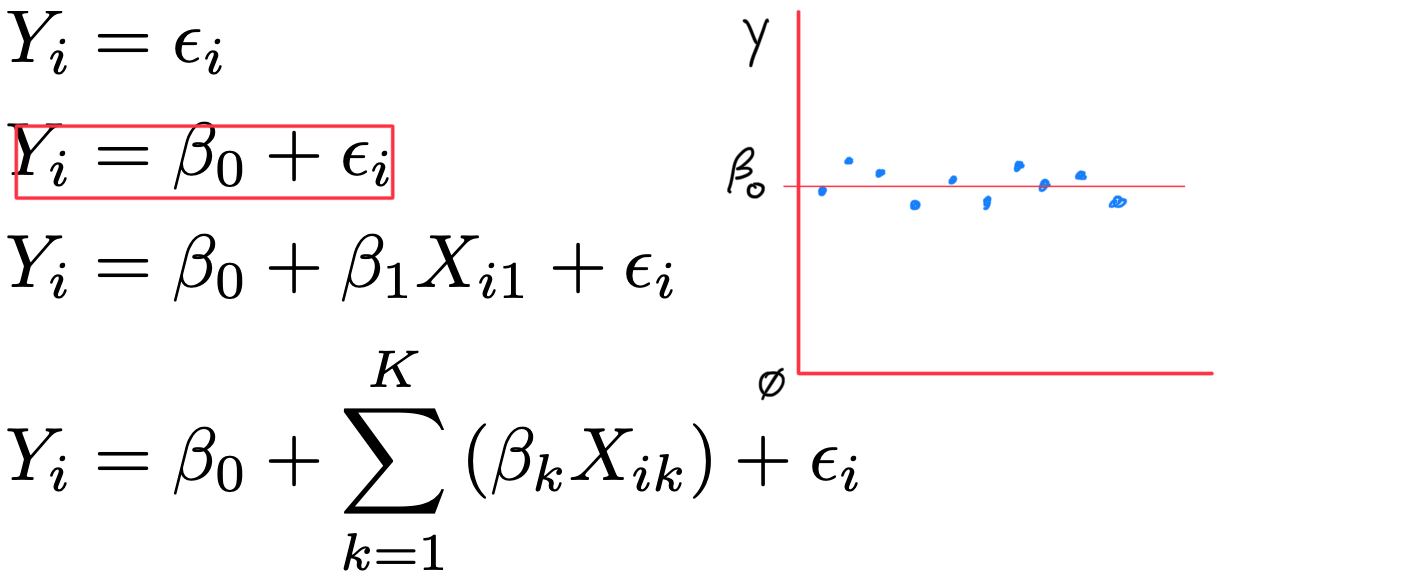
- Y_{i} = \beta_{0} + \varepsilon_{i}
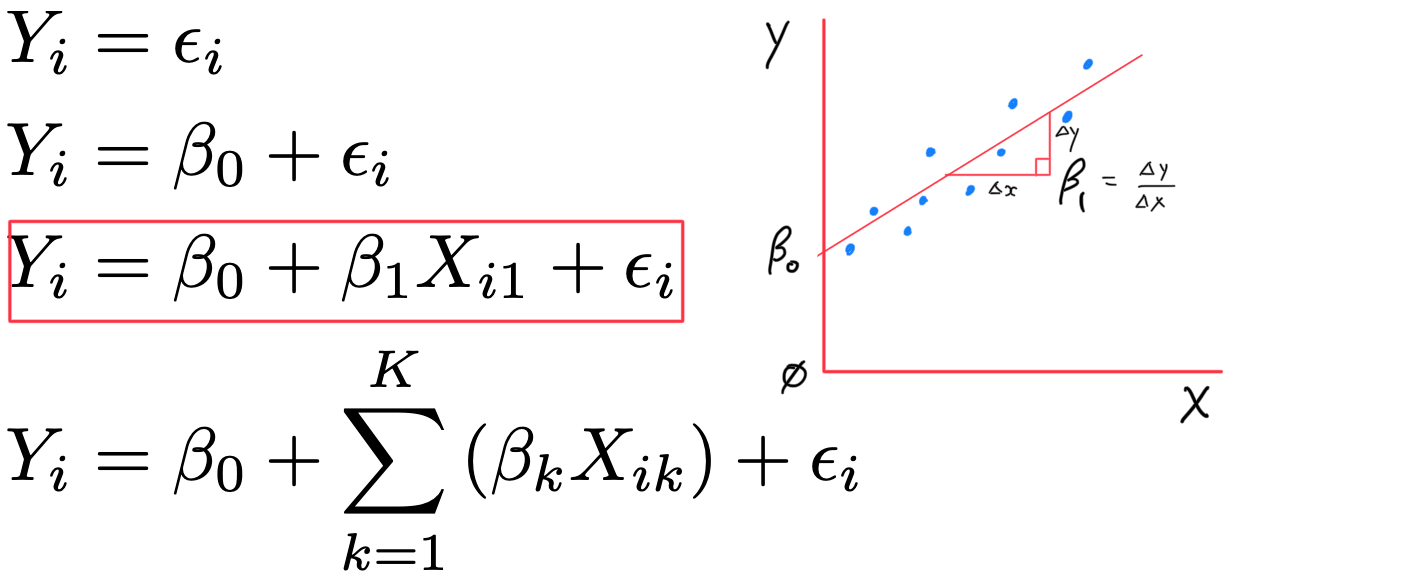
- Y_{i} = \beta_{0} + \beta_{1} X_{i1} + \varepsilon_{i}
- Y_{i} = \beta_{0} + \beta_{1} X_{i1} + \beta_{2} X_{i2} + \varepsilon_{i}
- Y_{i} = \beta_{0} + \beta_{1} X_{i1} + \beta_{2} X_{i2} + \beta_{3} X_{i3} + \varepsilon_{i}
- Y_{i} = \beta_{0} + \beta_{1} X_{i1} + \beta_{2} X_{i2} + \beta_{3} X_{i3} + \beta_{4} X_{i4} + \varepsilon_{i}
Linear Models
- Y_{i} = \varepsilon_{i}
- Y_{i} = \beta_{0} + \varepsilon_{i}
- Y_{i} = \beta_{0} + \beta_{1} X_{i1} + \varepsilon_{i}
- Y_{i} = \beta_{0} + \displaystyle\sum_{k=1}^{K}{\left( \beta_{k} X_{ik} \right)} + \varepsilon_{i}
Linear Models
Linear Models
Linear Models
Linear Models
